| Date | May 2015 | Marks available | 3 | Reference code | 15M.2.hl.TZ1.11 |
| Level | HL only | Paper | 2 | Time zone | TZ1 |
| Command term | Show that | Question number | 11 | Adapted from | N/A |
Question
The probability density function of a continuous random variable \(X\) is given by
\[f(x) = \left\{ {\begin{array}{*{20}{c}} {0,{\text{ }}x < 0} \\ {\frac{{\sin x}}{4},{\text{ }}0 \le x \le \pi } \\ {a(x - \pi ),{\text{ }}\pi < x \le 2\pi } \\ {0,{\text{ }}2\pi < x} \end{array}.} \right.\]
Sketch the graph \(y = f(x)\).
Find \({\text{P}}(X \le \pi )\).
Show that \(a = \frac{1}{{{\pi ^2}}}\).
Write down the median of \(X\).
Calculate the mean of \(X\).
Calculate the variance of \(X\).
Find \({\text{P}}\left( {\frac{\pi }{2} \le X \le \frac{{3\pi }}{2}} \right)\).
Given that \(\frac{\pi }{2} \le X \le \frac{{3\pi }}{2}\) find the probability that \(\pi \le X \le 2\pi \).
Markscheme
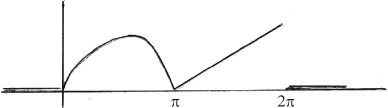
Award A1 for sine curve from \(0\) to \(\pi \), award A1 for straight line from \(\pi \) to \(2\pi \) A1A1
[2 marks]
\(\int_0^\pi {\frac{{\sin x}}{4}{\text{d}}x = \frac{1}{2}} \) (M1)A1
[2 marks]
METHOD 1
require \(\frac{1}{2} + \int_\pi ^{2\pi } {a(x - \pi ){\text{d}}x = 1} \) (M1)
\( \Rightarrow \frac{1}{2} + a\left[ {\frac{{{{(x - \pi )}^2}}}{2}} \right]_\pi ^{2\pi } = 1\;\;\;\left( {{\text{or }}\frac{1}{2} + a\left[ {\frac{{{x^2}}}{2} - \pi x} \right]_\pi ^{2\pi } = 1} \right)\) A1
\( \Rightarrow a\frac{{{\pi ^2}}}{2} = \frac{1}{2}\) A1
\( \Rightarrow a = \frac{1}{{{\pi ^2}}}\) AG
Note: Must obtain the exact value. Do not accept answers obtained with calculator.
METHOD 2
\(0.5 + {\text{ area of triangle }} = 1\) R1
area of triangle \( = \frac{1}{2}\pi \times a\pi = 0.5\) M1A1
Note: Award M1 for correct use of area formula \( = 0.5\), A1 for \(a\pi \).
\(a = \frac{1}{{{\pi ^2}}}\) AG
[3 marks]
median is \(\pi \) A1
[1 mark]
\(\mu = \int_0^\pi {x \cdot \frac{{\sin x}}{4}{\text{d}}x + \int_\pi ^{2\pi } {x \cdot \frac{{x - \pi }}{{{\pi ^2}}}{\text{d}}x} } \) (M1)(A1)
\( = 3.40339 \ldots = 3.40\;\;\;\left( {{\text{or }}\frac{\pi }{4} + \frac{{5\pi }}{6} = \frac{{13}}{{12}}\pi } \right)\) A1
[3 marks]
For \(\mu = 3.40339 \ldots \)
EITHER
\({\sigma ^2} = \int_0^\pi {{x^2} \cdot \frac{{\sin x}}{4}{\text{d}}x + \int_\pi ^{2\pi } {{x^2} \cdot \frac{{x - \pi }}{{{\pi ^2}}}{\text{d}}x - {\mu ^2}} } \) (M1)(A1)
OR
\({\sigma ^2} = \int_0^\pi {{{(x - \mu )}^2} \cdot \frac{{\sin x}}{4}{\text{d}}x + \int_\pi ^{2\pi } {{{(x - \mu )}^2} \cdot \frac{{x - \pi }}{{{\pi ^2}}}{\text{d}}x} } \) (M1)(A1)
THEN
\( = 3.866277 \ldots = 3.87\) A1
[3 marks]
\(\int_{\frac{\pi }{2}}^\pi {\frac{{\sin x}}{4}{\text{d}}x + \int_\pi ^{\frac{{3\pi }}{2}} {\frac{{x - \pi }}{{{\pi ^2}}}{\text{d}}x = 0.375\;\;\;\left( {{\text{or }}\frac{1}{4} + \frac{1}{8} = \frac{3}{8}} \right)} } \) (M1)A1
[2 marks]
\({\text{P}}\left( {\pi \le X \le 2\pi \left| {\frac{\pi }{2} \le X \le \frac{{3\pi }}{2}} \right.} \right) = \frac{{{\text{P}}\left( {\pi \le X \le \frac{{3\pi }}{2}} \right)}}{{{\text{P}}\left( {\frac{\pi }{2} \le X \le \frac{{3\pi }}{2}} \right)}}\) (M1)(A1)
\( = \frac{{\int_\pi ^{\frac{{3\pi }}{2}} {\frac{{(x - \pi )}}{{{\pi ^2}}}{\text{d}}x} }}{{0.375}} = \frac{{0.125}}{{0.375}}\;\;\;\left( {{\text{or }} = \frac{{\frac{1}{8}}}{{\frac{3}{8}}}{\text{ from diagram areas}}} \right)\) (M1)
\( = \frac{1}{3}\;\;\;(0.333)\) A1
[4 marks]
Total [20 marks]
Examiners report
Most candidates sketched the graph correctly. In a few cases candidates did not seem familiar with the shape of the graphs and ignored the fact that the graph represented a pdf. The correct sketch assisted greatly in the rest of the question.
Most candidates answered this question correctly.
A few good proofs were seen but also many poor answers where the candidates assumed what you were trying to prove and verified numerically the result.
Most candidates stated the value correctly but many others showed no understanding of the concept.
Many candidates scored full marks in this question; many others could not apply the formula due to difficulties in dealing with the piecewise function. For example, a number of candidates divided the final answer by two.
Many misconceptions were identified: use of incorrect formula (e.g. formula for discrete distributions), use of both expressions as integrand and division of the result by 2 at the end.
This part was fairly well done with many candidates achieving full marks.
Many candidates had difficulties with this part showing that the concept of conditional probability was poorly understood. The best candidates did it correctly from the sketch.