| Date | May 2014 | Marks available | 6 | Reference code | 14M.1.hl.TZ1.6 |
| Level | HL only | Paper | 1 | Time zone | TZ1 |
| Command term | Sketch and State | Question number | 6 | Adapted from | N/A |
Question
The first set of axes below shows the graph of \(y = {\text{ }}f(x)\) for \( - 4 \leqslant x \leqslant 4\).
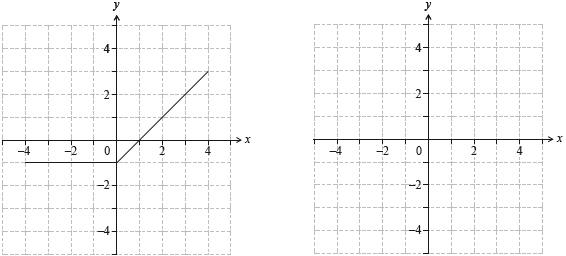
Let \(g(x) = \int_{ - 4}^x {f(t){\text{d}}t} \) for \( - 4 \leqslant x \leqslant 4\).
(a) State the value of x at which \(g(x)\) is a minimum.
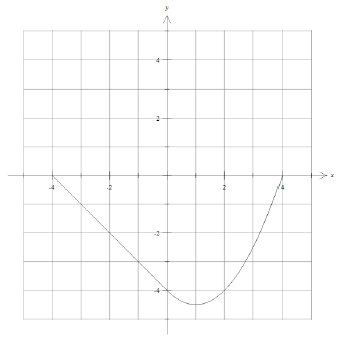
(b) On the second set of axes, sketch the graph of \(y = g(x)\).
Markscheme
(a) \(x = 1\) A1
[1 mark]
(b) A1 for point (–4, 0)
A1 for (0, − 4)
A1 for min at \(x = 1\) in approximately the correct place
A1 for (4, 0)
A1 for shape including continuity at \(x = 0\)
[5 marks]
Total [6 marks]
Examiners report
[N/A]
Syllabus sections
Topic 6 - Core: Calculus » 6.5 » Area of the region enclosed by a curve and the \(x\)-axis or \(y\)-axis in a given interval; areas of regions enclosed by curves.
Show 31 related questions