| Date | May 2009 | Marks available | 3 | Reference code | 09M.2.hl.TZ1.2 |
| Level | HL | Paper | 2 | Time zone | TZ1 |
| Command term | Sketch | Question number | 2 | Adapted from | N/A |
Question
The \({\text{p}}{K_{\text{a}}}\) value for propanoic acid is given in Table 15 of the Data Booklet.
State the equation for the reaction of propanoic acid with water.
Calculate the hydrogen ion concentration (in \({\text{mol}}\,{\text{d}}{{\text{m}}^{ - 3}}\)) of an aqueous solution of \({\text{0.100 mol}}\,{\text{d}}{{\text{m}}^{ - 3}}\) propanoic acid.
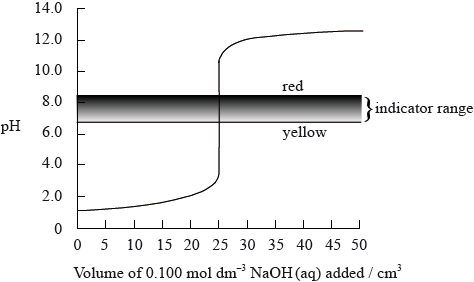
The graph below shows a computer simulation of a titration of \({\text{25.0 c}}{{\text{m}}^{\text{3}}}\) of \({\text{0.100 mol}}\,{\text{d}}{{\text{m}}^{ - 3}}\) hydrochloric acid with \({\text{0.100 mol}}\,{\text{d}}{{\text{m}}^{ - 3}}\) sodium hydroxide and the pH range of phenol red indicator.

Sketch the graph that would be obtained for the titration of \({\text{25.0 c}}{{\text{m}}^{\text{3}}}\) of \({\text{0.100 mol}}\,{\text{d}}{{\text{m}}^{ - 3}}\) propanoic acid with \({\text{0.100 mol}}\,{\text{d}}{{\text{m}}^{ - 3}}\) potassium hydroxide using bromophenol blue as an indicator. (The pH range of bromophenol blue can be found in Table 16 of the Data Booklet).

Markscheme
\({\text{C}}{{\text{H}}_3}{\text{C}}{{\text{H}}_2}{\text{COOH}} + {{\text{H}}_2}{\text{O}} \rightleftharpoons {\text{C}}{{\text{H}}_3}{\text{C}}{{\text{H}}_2}{\text{CO}}{{\text{O}}^ - } + {{\text{H}}_3}{{\text{O}}^ + }\) /
\({\text{C}}{{\text{H}}_3}{\text{C}}{{\text{H}}_2}{\text{COOH}} \rightleftharpoons {\text{C}}{{\text{H}}_3}{\text{C}}{{\text{H}}_2}{\text{COO}}{{\text{H}}^ - } + {{\text{H}}^ + }\);
\( \rightleftharpoons \) required for mark.
(\({\text{p}}{K_{\text{a}}}\) for propanoic acid = 4.87)
\({{\text{[}}{{\text{H}}^ + }{\text{]}}^2} = 0.100 \times {K_{\text{a}}}\);
\({\text{[}}{{\text{H}}^ + }{\text{]}} = 1.16 \times {10^{ - 3}}{\text{ (mol}}\,{\text{d}}{{\text{m}}^{ - 3}})\);
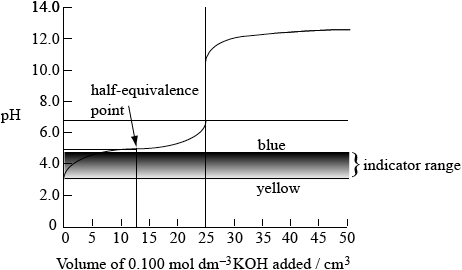
sketch to show:

indicator range between pH 3.0 and pH 4.6 (with “yellow” at pH 3.0 and “blue” at pH 4.6);
initial pH of acid at 2.9 ± 1.0 (when no KOH has been added);
half-equivalence point (does not need to be named) at pH 4.9 when \({\text{12.5 c}}{{\text{m}}^{\text{3}}}\) of KOH have been added;
equivalence point at approx pH 8.5 – 9.0 when \({\text{25.0 c}}{{\text{m}}^{\text{3}}}\) of KOH(aq) added;
upper part of curve from 25.0 – 50.0 \({\text{c}}{{\text{m}}^{\text{3}}}\) added identical to original curve;
Award [1] each for any three points.
Examiners report
The equation of propanoic acid with water was problematic for many candidates who omitted the equilibrium arrow \(( \rightleftharpoons )\) in part (a)(i). Although candidates were referred to the Data Booklet, some candidates did not know the formula of propanoic acid.
Part (a)(ii) was answered well by about half the candidates.
Part (b) also caused difficulties, with many candidates scoring only the mark for showing the pH range of bromophenol blue. Some candidates were thrown by the choice of indicator and selected a more appropriate indicator for these reagents. It is important to answer the question on the paper as the indicator was deliberately chosen to be different to the indicator used in the example. Graphs were generally badly and roughly drawn. Even candidates who had correctly calculated \({\text{[}}{{\text{H}}^ + }{\text{]}}\) in part (a) often did not start the graph at the correct pH. Most graphs finished too low at a pH of 10 or less, and the vertical part of the graph was frequently at a volume less than \({\text{25 c}}{{\text{m}}^{\text{3}}}\). Rarely did a candidate get the half-equivalence value correct.

