| Date | May 2011 | Marks available | 1 | Reference code | 11M.1.hl.TZ2.29 |
| Level | HL | Paper | 1 | Time zone | TZ2 |
| Command term | Deduce | Question number | 29 | Adapted from | N/A |
Question
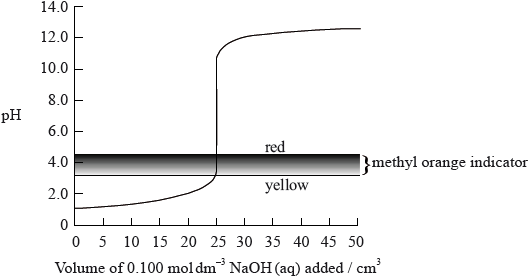
The graph below shows the titration curve of \({\text{25 c}}{{\text{m}}^{\text{3}}}\) of \({\text{0.100 mol}}\,{\text{d}}{{\text{m}}^{ - 3}}\) of hydrochloric acid with sodium hydroxide, of \({\text{0.100 mol}}\,{\text{d}}{{\text{m}}^{ - 3}}\) concentration. The indicator methyl orange was used to determine the equivalence point. Methyl orange has a pH range of 3.2– 4.4.
If the hydrochloric acid was replaced by ethanoic acid of the same volume and concentration, which property of the titration would remain the same?
A. The initial pH
B. The pH at the equivalence point
C. The volume of strong base, NaOH, needed to reach the equivalence point
D. The colour of the titration mixture just before the equivalence point is reached
Markscheme
C
Examiners report
There were three G2 comments on this question. Some commented on the length of the question itself. The question certainly was challenging though 53.88% of candidates did manage to get the correct answer C.