| Date | May 2014 | Marks available | 1 | Reference code | 14M.1.sl.TZ1.4 |
| Level | SL only | Paper | 1 | Time zone | TZ1 |
| Command term | State | Question number | 4 | Adapted from | N/A |
Question
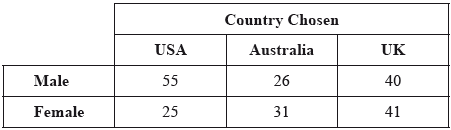
A study was carried out to determine whether the country chosen by students for their university studies was influenced by a person’s gender. A random sample was taken. The results are shown in the following table.
A \({\chi ^2}\) test was performed at the 1% significance level.
The critical value for this test is 9.210.
State the null hypothesis.
Write down the number of degrees of freedom.
Write down
(i) the \({\chi ^2}\) statistic;
(ii) the associated p-value.
State, giving a reason, whether the null hypothesis should be accepted.
Markscheme
Country chosen and gender are independent. (A1) (C1)
Notes: Accept there is no association between country chosen and gender.
Do not accept “not related” or “not correlated” or “influenced”.
[1 mark]
2 (A1) (C1)
[1 mark]
(i) 9.17 (9.16988…) (A1)
Notes: Accept 9.169.
(ii) 0.0102 (0.0102043…) (A1) (C2)
Notes: Award (A1) for 0.010, but (A0) for 0.01.
[2 marks]
Since \(0.0102 > 0.01\), we accept the null hypothesis. (R1)(A1)(ft)
OR
Since \(9.17 < 9.210\), we accept the null hypothesis. (R1)(A1)(ft) (C2)
Notes: To award (R1) there should be value(s) given in part (c). If a value is given in (c), we do not need it explicitly stated again in (d).
It is sufficient to state a correct comparison.
e.g. \(p{\text{-value}} > {\text{significance level}}\) OR \(\chi _{{\text{calc}}}^2 < {\text{critical value}}\)
Do not award (R0)(A1). Follow through from part (c).
[2 marks]