| Date | May 2017 | Marks available | 1 | Reference code | 17M.2.sl.TZ2.3 |
| Level | SL only | Paper | 2 | Time zone | TZ2 |
| Command term | Write down | Question number | 3 | Adapted from | N/A |
Question
The manager of a folder factory recorded the number of folders produced by the factory (in thousands) and the production costs (in thousand Euros), for six consecutive months.
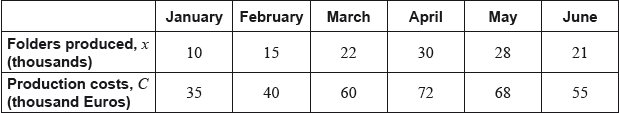
Every month the factory sells all the folders produced. Each folder is sold for 2.99 Euros.
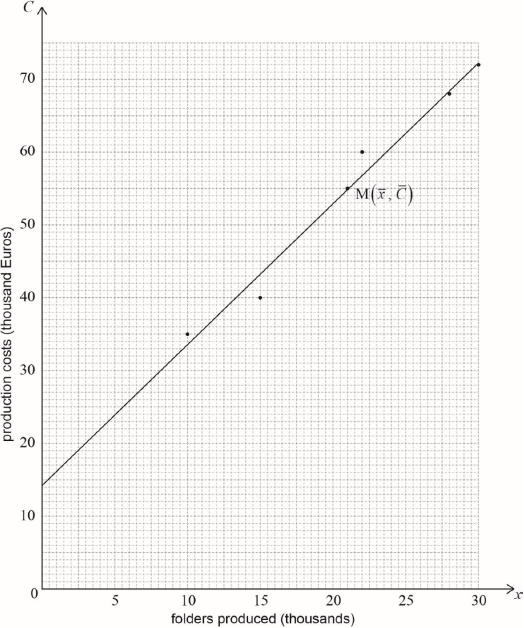
Draw a scatter diagram for this data. Use a scale of 2 cm for 5000 folders on the horizontal axis and 2 cm for 10 000 Euros on the vertical axis.
Write down, for this set of data the mean number of folders produced, \(\bar x\);
Write down, for this set of data the mean production cost, \(\bar C\).
Label the point \({\text{M}}(\bar x,{\text{ }}\bar C)\) on the scatter diagram.
Use your graphic display calculator to find the Pearson’s product–moment correlation coefficient, \(r\).
State a reason why the regression line \(C\) on \(x\) is appropriate to model the relationship between these variables.
Use your graphic display calculator to find the equation of the regression line \(C\) on \(x\).
Draw the regression line \(C\) on \(x\) on the scatter diagram.
Use the equation of the regression line to estimate the least number of folders that the factory needs to sell in a month to exceed its production cost for that month.
Markscheme
 (A4)
(A4)
Notes: Award (A1) for correct scales and labels. Award (A0) if axes are reversed and follow through for their points.
Award (A3) for all six points correctly plotted, (A2) for four or five points correctly plotted, (A1) for two or three points correctly plotted.
If graph paper has not been used, award at most (A1)(A0)(A0)(A0). If accuracy cannot be determined award (A0)(A0)(A0)(A0).
[4 marks]
\((\bar x = ){\text{ }}21\) (A1)(G1)
[1 mark]
\((\bar C = ){\text{ }}55\) (A1)(G1)
Note: Accept (i) 21000 and (ii) 55000 seen.
[1 mark]
their mean point M labelled on diagram (A1)(ft)(G1)
Note: Follow through from part (b).
Award (A1)(ft) if their part (b) is correct and their attempt at plotting \((21,{\text{ }}55)\) in part (a) is labelled M.
If graph paper not used, award (A1) if \((21,{\text{ }}55)\) is labelled. If their answer from part (b) is incorrect and accuracy cannot be determined, award (A0).
[1 mark]
\((r = ){\text{ }}0.990{\text{ }}(0.989568 \ldots )\) (G2)
Note: Award (G2) for 0.99 seen. Award (G1) for 0.98 or 0.989. Do not accept 1.00.
[2 marks]
the correlation coefficient/r is (very) close to 1 (R1)(ft)
OR
the correlation is (very) strong (R1)(ft)
Note: Follow through from their answer to part (d).
OR
the position of the data points on the scatter graphs suggests that the tendency is linear (R1)(ft)
Note: Follow through from their scatter graph in part (a).
[1 mark]
\(C = 1.94x + 14.2{\text{ }}(C = 1.94097 \ldots x + 14.2395 \ldots )\) (G2)
Notes: Award (G1) for \(1.94x\), (G1) for 14.2.
Award a maximum of (G0)(G1) if the answer is not an equation.
Award (G0)(G1)(ft) if gradient and \(C\)-intercept are swapped in the equation.
[2 marks]
straight line through their \({\text{M}}(21,{\text{ }}55)\) (A1)(ft)
\(C\)-intercept of the line (or extension of line) passing through \(14.2{\text{ }}( \pm 1)\) (A1)(ft)
Notes: Follow through from part (f). In the event that the regression line is not straight (ruler not used), award (A0)(A1)(ft) if line passes through both their \((21,{\text{ }}55)\) and \((0,{\text{ }}14.2)\), otherwise award (A0)(A0). The line must pass through the midpoint, not near this point. If it is not clear award (A0).
If graph paper is not used, award at most (A1)(ft)(A0).
[2 marks]
\(2.99x = 1.94097 \ldots x + 14.2395 \ldots \) (M1)(M1)
Note: Award (M1) for \(2.99x\) seen and (M1) for equating to their equation of the regression line. Accept an inequality sign.
Accept a correct graphical method involving their part (f) and \(2.99x\).
Accept \(C = 2.99x\) drawn on their scatter graph.
\(x = 13.5739 \ldots \) (this step may be implied by their final answer) (A1)(ft)(G2)
\(13\,600{\text{ }}(13\,574)\) (A1)(ft)(G3)
Note: Follow through from their answer to (f). Use of 3 sf gives an answer of \(13\,524\).
Award (G2) for \({\text{13.5739}} \ldots \) or 13.524 or a value which rounds to 13500 seen without workings.
Award the last (A1)(ft) for correct multiplication by 1000 and an answer satisfying revenue > their production cost.
Accept 13.6 thousand (folders).
[4 marks]