| Date | November 2014 | Marks available | 4 | Reference code | 14N.2.sl.TZ0.1 |
| Level | SL only | Paper | 2 | Time zone | TZ0 |
| Command term | Draw and Use | Question number | 1 | Adapted from | N/A |
Question
A biologist is studying the relationship between the number of chirps of the Snowy Tree cricket and the air temperature. He records the chirp rate, \(x\), of a cricket, and the corresponding air temperature, \(T\), in degrees Celsius.
The following table gives the recorded values.
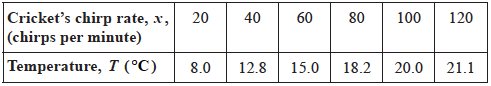
Draw the scatter diagram for the above data. Use a scale of 2 cm for 20 chirps on the horizontal axis and 2 cm for 4°C on the vertical axis.
Use your graphic display calculator to write down the Pearson’s product–moment correlation coefficient, \(r\), between \(x\) and \(T\).
Interpret the relationship between \(x\) and \(T\) using your value of \(r\).
Use your graphic display calculator to write down the equation of the regression line \(T\) on \(x\). Give the equation in the form \(T = ax + b\).
Calculate the air temperature when the cricket’s chirp rate is \(70\).
Given that \(\bar x = 70\), draw the regression line \(T\) on \(x\) on your scatter diagram.
A forest ranger uses her own formula for estimating the air temperature. She counts the number of chirps in 15 seconds, \(z\), multiplies this number by \(0.45\) and then she adds \(10\).
Write down the formula that the forest ranger uses for estimating the temperature, \(T\).
Give the equation in the form \(T = mz + n\).
A cricket makes 20 chirps in 15 seconds.
For this chirp rate
(i) calculate an estimate for the temperature, \(T\), using the forest ranger’s formula;
(ii) determine the actual temperature recorded by the biologist, using the table above;
(iii) calculate the percentage error in the forest ranger’s estimate for the temperature, compared to the actual temperature recorded by the biologist.
Markscheme

(A4)
Notes: Award (A1) for correct scales and labels.
Award (A3) for all six points correctly plotted,
(A2) for four or five points correctly plotted,
(A1) for two or three points correctly plotted.
Award at most (A0)(A3) if axes reversed.
Accept tolerance for \(T\)-axis.
\({\text{0.977}}\;\;\;{\text{(0.977324}} \ldots {\text{)}}\) (G2)
Notes: Award (G1) for \(0.97\).
(Very) strong positive correlation (A1)(ft)(A1)(ft)
Notes: Award (A1) for (very) strong, (A1) for positive.
Follow through from part (b).
\(T = 0.129x + 6.82\) (G2)
Notes: Award (G1) for \(0.129x\), (G1) for \( + 6.82\).
Award a maximum of (G0)(G1) if the answer is not an equation.
\(0.129 \times 70 + 6.82\) (M1)
Note: Award (M1) for substitution of 70 into their equation of regression line.
OR
\(\frac{{8 + 12.8 + \ldots + 21.1}}{6}\) (M1)
\( = 15.9{\text{ }}(15.85)\) (A1)(ft)(G2)
Note: Follow through from part (d) without working.
regression line through \((70,{\text{ }}15.9)\) (A1)(ft)
Note: Accept \(15.9 \pm 0.2\).
Follow through from part (e).
with \(T\)-intercept, \(6.82\) (A1)(ft)
Note: Follow through from part (d). Accept \(6.82 \pm 0.2\).
In case the regression line is not straight (ruler not used), award (A0)(A1)(ft) if line passes through both their \((70,{\text{ }}15.9)\) and \((0,{\text{ }}6.82)\), otherwise award (A0)(A0).
Do not penalize if line does not intersect the \(T\)-axis.
\(T = 0.45z + 10\) (A1)
(i) \(0.45(20) + 10\) (M1)
Note: Award (M1) for correct substitution of \(20\) into their formula from part (g).
\( = 19\;\;\;(^\circ {\text{C}})\) (A1)(ft)(G2)
Note: Follow through from part (g).
(ii) \( = 18.2\;\;\;(^\circ {\text{C}})\) (A1)
(iii) \(\left| {\frac{{19 - 18.2}}{{18.2}}} \right| \times 100\% \) (M1)(A1)(ft)
Note: Award (M1) for substitution in the percentage error formula, (A1) for correct substitution.
\({\text{4.40% }}\;\;\;{\text{(4.39560}} \ldots {\text{)}}\) (A1)(ft)(G2)
Notes: Follow through from parts (h)(i) and (h)(ii).