| Date | November 2013 | Marks available | 4 | Reference code | 13N.2.sl.TZ0.1 |
| Level | SL only | Paper | 2 | Time zone | TZ0 |
| Command term | Draw | Question number | 1 | Adapted from | N/A |
Question
The table shows the distance, in km, of eight regional railway stations from a city centre terminus and the price, in \($\), of a return ticket from each regional station to the terminus.
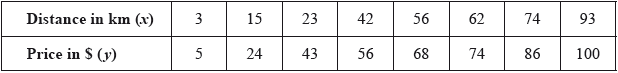
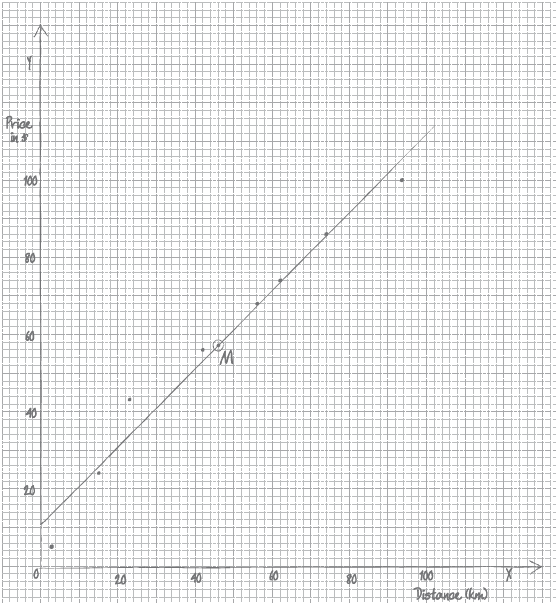
Draw a scatter diagram for the above data. Use a scale of \(1\) cm to represent \(10\) km on the \(x\)-axis and \(1\) cm to represent \(\$10\) on the \(y\)-axis.
Use your graphic display calculator to find
(i) \(\bar x\), the mean of the distances;
(ii) \(\bar y\), the mean of the prices.
Plot and label the point \({\text{M }}(\bar x,{\text{ }}\bar y)\) on your scatter diagram.
Use your graphic display calculator to find
(i) the product–moment correlation coefficient, \(r\,;\)
(ii) the equation of the regression line \(y\) on \(x\).
Draw the regression line \(y\) on \(x\) on your scatter diagram.
A ninth regional station is \(76\) km from the city centre terminus.
Use the equation of the regression line to estimate the price of a return ticket to the city centre terminus from this regional station. Give your answer correct to the nearest \({\mathbf{\$ }}\).
Give a reason why it is valid to use your regression line to estimate the price of this return ticket.
The actual price of the return ticket is \(\$80\).
Using your answer to part (f), calculate the percentage error in the estimated price of the ticket.
Markscheme
 (A4)
(A4)
Notes: Award (A1) for correct scale and labels (accept \(x\) and \(y\)).
Award (A3) for \(7\) or \(8\) points plotted correctly.
Award (A2) for \(5\) or \(6\) points plotted correctly.
Award (A1) for \(3\) or \(4\) points plotted correctly.
Award at most (A1)(A2) if points are joined up.
If axes are reversed, award at most (A0)(A3).
If graph paper is not used, award at most (A1)(A0).
[4 marks]
(i) \((\bar x = ){\text{ 46}}\) (G1)
(ii) \((\bar y = ){\text{ 57}}\) (G1)
[2 marks]
\({\text{M}} (46, 57)\) plotted and labelled on the scatter diagram (A1)(ft)
Notes: Follow through from their part (b).
Accept \((\bar x,{\text{ }}\bar y)\) as the label.
[1 mark]
(i) \(0.986\) \((0.986322...)\) (G1)
(ii) \(y = 1.01x + 10.3\) \((y = 1.01431 \ldots x + 10.3412 \ldots )\) (G1)(G1)
Notes: Award (G1) for \(1.01x\), (G1) for \(10.3\).
Award (G1)(G0) if not written in the form of an equation.
OR
\((y - 57) = 1.01(x - 46)\) \(\left( {y - 57 = 1.01431...(x - 46)} \right)\) (G1)(G1)(ft)
Note: Award (G1) for \(1.01\), (G1) for their \(57\) and \(46\).
[3 marks]
straight line drawn on the scatter diagram (A1)(ft)(A1)(ft)
Notes: The line must be straight for either of the two marks to be awarded.
Award (A1)(ft) passing through their \({\text{M}}\) plotted in (c).
Award (A1)(ft) for correct \(y\)-intercept (between \(9\) and \(12\)).
Follow through from their \(y\)-intercept found in part (d).
If part (d) is used, award (A1)(ft) for their intercept \(( \pm 1)\).
[2 marks]
\(y = 1.01431... \times 76 + 10.3412…\) (M1)
Note: Award (M1) for substitution of \(76\) into their regression line.
\( = 87.4295…\) (A1)(ft)
Note: Follow through from part (d). If 3 sf values are used the value is \(87.06\).
\(\$87\) (A1)(ft)(G2)
Notes: The final (A1) is awarded for their answer given correct to the nearest dollar.
Method, followed by the answer of \(87\) earns (M1)(G2). It is not necessary to see the interim step.
Where the candidate uses their graph instead of the equation, and arrives at an answer other than \(87\), award, at most, (G1)(ft).
If the candidate uses their graph and arrives at the required answer of \(87\), award (G2)(ft).
[3 marks]
\(76\) is within the range of distances given in the data OR the correlation coefficient is close to \(1\). (R1)
Notes: Award (R1) if either condition is given.
Sufficient to indicate that \(76\) is ‘within the data range’ and the correlation is ‘strong’.
Allow \({r^2}\) close to \(1\).
Do not accept “within the range of prices”.
[1 mark]
\({\text{Percentage error}} = \frac{{87 - 80}}{{80}} \times 100\) (M1)
Note: Award (M1) for correct substitution into formula.
\(8.75\%\) (A1)(ft)(G2)
Notes: Follow through from their answer to part (f).
Accept either the rounded or unrounded answer to part (f).
If no integer value seen in part (f), follow through from their unrounded answer to part (f).
Answer must be positive.
[2 marks]
Examiners report
This question was very well attempted by a significant majority of candidates. Many good and accurate attempts at plotting a scatter diagram were seen in part (a). However, a minority of candidates chose not to use graph paper but instead used their answer book. These candidates achieved, at most, one mark for that part question. Many correct answers were seen in parts (b) and (d) reflecting good use of the graphic display calculator. Whilst many candidates realized that the line of regression passes through the point M, a significant number of candidates seemed to draw their line ‘by eye’ rather than using the equation found in part (d) and, as a consequence for many, their straight line (or projected line) did not fall within the required tolerances for the second mark. Many candidates understood the requirements for part (f) and full marks were seen on a majority of scripts. Those candidates, however, who used their graph instead scored, at most, two marks here. Many candidates seemed to be well-drilled in giving a suitable reason in part (f) and ‘within the data range’ or a ‘strong correlation’ were frequently seen. Percentage error caused very few problems for candidates and many correct answers were seen in part (h).
This question was very well attempted by a significant majority of candidates. Many good and accurate attempts at plotting a scatter diagram were seen in part (a). However, a minority of candidates chose not to use graph paper but instead used their answer book. These candidates achieved, at most, one mark for that part question. Many correct answers were seen in parts (b) and (d) reflecting good use of the graphic display calculator. Whilst many candidates realized that the line of regression passes through the point M, a significant number of candidates seemed to draw their line ‘by eye’ rather than using the equation found in part (d) and, as a consequence for many, their straight line (or projected line) did not fall within the required tolerances for the second mark. Many candidates understood the requirements for part (f) and full marks were seen on a majority of scripts. Those candidates, however, who used their graph instead scored, at most, two marks here. Many candidates seemed to be well-drilled in giving a suitable reason in part (f) and ‘within the data range’ or a ‘strong correlation’ were frequently seen. Percentage error caused very few problems for candidates and many correct answers were seen in part (h).
This question was very well attempted by a significant majority of candidates. Many good and accurate attempts at plotting a scatter diagram were seen in part (a). However, a minority of candidates chose not to use graph paper but instead used their answer book. These candidates achieved, at most, one mark for that part question. Many correct answers were seen in parts (b) and (d) reflecting good use of the graphic display calculator. Whilst many candidates realized that the line of regression passes through the point M, a significant number of candidates seemed to draw their line ‘by eye’ rather than using the equation found in part (d) and, as a consequence for many, their straight line (or projected line) did not fall within the required tolerances for the second mark. Many candidates understood the requirements for part (f) and full marks were seen on a majority of scripts. Those candidates, however, who used their graph instead scored, at most, two marks here. Many candidates seemed to be well-drilled in giving a suitable reason in part (f) and ‘within the data range’ or a ‘strong correlation’ were frequently seen. Percentage error caused very few problems for candidates and many correct answers were seen in part (h).
This question was very well attempted by a significant majority of candidates. Many good and accurate attempts at plotting a scatter diagram were seen in part (a). However, a minority of candidates chose not to use graph paper but instead used their answer book. These candidates achieved, at most, one mark for that part question. Many correct answers were seen in parts (b) and (d) reflecting good use of the graphic display calculator. Whilst many candidates realized that the line of regression passes through the point M, a significant number of candidates seemed to draw their line ‘by eye’ rather than using the equation found in part (d) and, as a consequence for many, their straight line (or projected line) did not fall within the required tolerances for the second mark. Many candidates understood the requirements for part (f) and full marks were seen on a majority of scripts. Those candidates, however, who used their graph instead scored, at most, two marks here. Many candidates seemed to be well-drilled in giving a suitable reason in part (f) and ‘within the data range’ or a ‘strong correlation’ were frequently seen. Percentage error caused very few problems for candidates and many correct answers were seen in part (h).
This question was very well attempted by a significant majority of candidates. Many good and accurate attempts at plotting a scatter diagram were seen in part (a). However, a minority of candidates chose not to use graph paper but instead used their answer book. These candidates achieved, at most, one mark for that part question. Many correct answers were seen in parts (b) and (d) reflecting good use of the graphic display calculator. Whilst many candidates realized that the line of regression passes through the point M, a significant number of candidates seemed to draw their line ‘by eye’ rather than using the equation found in part (d) and, as a consequence for many, their straight line (or projected line) did not fall within the required tolerances for the second mark. Many candidates understood the requirements for part (f) and full marks were seen on a majority of scripts. Those candidates, however, who used their graph instead scored, at most, two marks here. Many candidates seemed to be well-drilled in giving a suitable reason in part (f) and ‘within the data range’ or a ‘strong correlation’ were frequently seen. Percentage error caused very few problems for candidates and many correct answers were seen in part (h).
This question was very well attempted by a significant majority of candidates. Many good and accurate attempts at plotting a scatter diagram were seen in part (a). However, a minority of candidates chose not to use graph paper but instead used their answer book. These candidates achieved, at most, one mark for that part question. Many correct answers were seen in parts (b) and (d) reflecting good use of the graphic display calculator. Whilst many candidates realized that the line of regression passes through the point M, a significant number of candidates seemed to draw their line ‘by eye’ rather than using the equation found in part (d) and, as a consequence for many, their straight line (or projected line) did not fall within the required tolerances for the second mark. Many candidates understood the requirements for part (f) and full marks were seen on a majority of scripts. Those candidates, however, who used their graph instead scored, at most, two marks here. Many candidates seemed to be well-drilled in giving a suitable reason in part (f) and ‘within the data range’ or a ‘strong correlation’ were frequently seen. Percentage error caused very few problems for candidates and many correct answers were seen in part (h).
This question was very well attempted by a significant majority of candidates. Many good and accurate attempts at plotting a scatter diagram were seen in part (a). However, a minority of candidates chose not to use graph paper but instead used their answer book. These candidates achieved, at most, one mark for that part question. Many correct answers were seen in parts (b) and (d) reflecting good use of the graphic display calculator. Whilst many candidates realized that the line of regression passes through the point M, a significant number of candidates seemed to draw their line ‘by eye’ rather than using the equation found in part (d) and, as a consequence for many, their straight line (or projected line) did not fall within the required tolerances for the second mark. Many candidates understood the requirements for part (f) and full marks were seen on a majority of scripts. Those candidates, however, who used their graph instead scored, at most, two marks here. Many candidates seemed to be well-drilled in giving a suitable reason in part (f) and ‘within the data range’ or a ‘strong correlation’ were frequently seen. Percentage error caused very few problems for candidates and many correct answers were seen in part (h).
This question was very well attempted by a significant majority of candidates. Many good and accurate attempts at plotting a scatter diagram were seen in part (a). However, a minority of candidates chose not to use graph paper but instead used their answer book. These candidates achieved, at most, one mark for that part question. Many correct answers were seen in parts (b) and (d) reflecting good use of the graphic display calculator. Whilst many candidates realized that the line of regression passes through the point M, a significant number of candidates seemed to draw their line ‘by eye’ rather than using the equation found in part (d) and, as a consequence for many, their straight line (or projected line) did not fall within the required tolerances for the second mark. Many candidates understood the requirements for part (f) and full marks were seen on a majority of scripts. Those candidates, however, who used their graph instead scored, at most, two marks here. Many candidates seemed to be well-drilled in giving a suitable reason in part (f) and ‘within the data range’ or a ‘strong correlation’ were frequently seen. Percentage error caused very few problems for candidates and many correct answers were seen in part (h).