| Date | November 2016 | Marks available | 1 | Reference code | 16N.2.sl.TZ0.1 |
| Level | SL only | Paper | 2 | Time zone | TZ0 |
| Command term | Write down | Question number | 1 | Adapted from | N/A |
Question
In the month before their IB Diploma examinations, eight male students recorded the number of hours they spent on social media.
For each student, the number of hours spent on social media (\(x\)) and the number of IB Diploma points obtained (\(y\)) are shown in the following table.

Use your graphic display calculator to find
Ten female students also recorded the number of hours they spent on social media in the month before their IB Diploma examinations. Each of these female students spent between 3 and 30 hours on social media.
The equation of the regression line y on x for these ten female students is
\[y = - \frac{2}{3}x + \frac{{125}}{3}.\]
An eleventh girl spent 34 hours on social media in the month before her IB Diploma examinations.
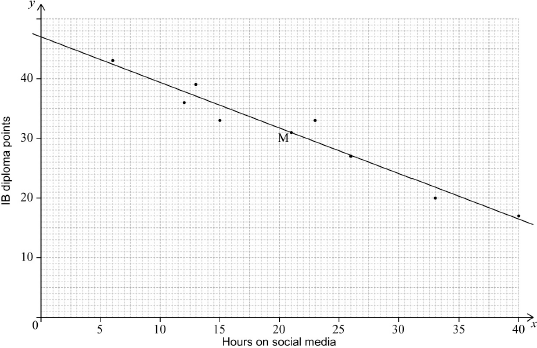
On graph paper, draw a scatter diagram for these data. Use a scale of 2 cm to represent 5 hours on the \(x\)-axis and 2 cm to represent 10 points on the \(y\)-axis.
(i) \({\bar x}\), the mean number of hours spent on social media;
(ii) \({\bar y}\), the mean number of IB Diploma points.
Plot the point \((\bar x,{\text{ }}\bar y)\) on your scatter diagram and label this point M.
Write down the value of \(r\), the Pearson’s product–moment correlation coefficient, for these data.
Write down the equation of the regression line \(y\) on \(x\) for these eight male students.
Draw the regression line, from part (e), on your scatter diagram.
Use the given equation of the regression line to estimate the number of IB Diploma points that this girl obtained.
Write down a reason why this estimate is not reliable.
Markscheme
 (A4)
(A4)
Notes: Award (A1) for correct scale and labelled axes.
Award (A3) for 7 or 8 points correctly plotted,
(A2) for 5 or 6 points correctly plotted,
(A1) for 3 or 4 points correctly plotted.
Award at most (A0)(A3) if axes reversed.
Accept \(x\) and \(y\) sufficient for labelling.
If graph paper is not used, award (A0).
If an inconsistent scale is used, award (A0). Candidates’ points should be read from this scale where possible and awarded accordingly.
A scale which is too small to be meaningful (ie mm instead of cm) earns (A0) for plotted points.
[4 marks]
(i) \(\bar x = 21\) (A1)
(ii) \(\bar y = 31\) (A1)
[2 marks]
\((\bar x,{\text{ }}\bar y)\) correctly plotted on graph (A1)(ft)
this point labelled M (A1)
Note: Follow through from parts (b)(i) and (b)(ii).
Only accept M for labelling.
[2 marks]
\( - 0.973{\text{ }}( - 0.973388 \ldots )\) (G2)
Note: Award (G1) for 0.973, without minus sign.
[2 marks]
\(y = - 0.761x + 47.0{\text{ }}(y = - 0.760638 \ldots x + 46.9734 \ldots )\) (A1)(A1)(G2)
Notes: Award (A1) for \( - 0.761x\) and (A1) \( + 47.0\). Award a maximum of (A1)(A0) if answer is not an equation.
[2 marks]
line on graph (A1)(ft)(A1)(ft)
Notes: Award (A1)(ft) for straight line that passes through their M, (A1)(ft) for line (extrapolated if necessary) that passes through \((0,{\text{ }}47.0)\).
If M is not plotted or labelled, follow through from part (e).
[2 marks]
\(y = - \frac{2}{3}(34) + \frac{{125}}{3}\) (M1)
Note: Award (M1) for correct substitution.
19 (points) (A1)(G2)
[2 marks]
extrapolation (R1)
OR
34 hours is outside the given range of data (R1)
Note: Do not accept ‘outlier’.
[1 mark]

