| Date | November 2008 | Marks available | 2 | Reference code | 08N.2.sl.TZ0.3 |
| Level | SL only | Paper | 2 | Time zone | TZ0 |
| Command term | Complete | Question number | 3 | Adapted from | N/A |
Question
The following is a cumulative frequency diagram for the time t, in minutes, taken by 80 students to complete a task.
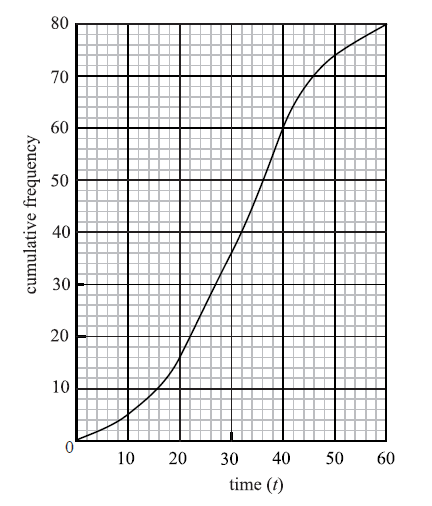
Write down the median.
Find the interquartile range.
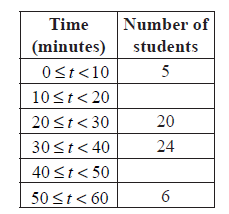
Complete the frequency table below.
Markscheme
median \(m = 32\) A1 N1
[1 mark]
lower quartile \({Q_1} = 22\) , upper quartile \({Q_3} = 40\) (A1)(A1)
\({\text{interquartile range}} = 18\) A1 N3
[3 marks]
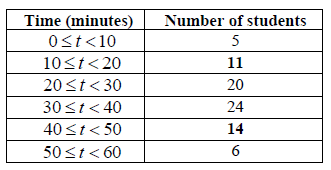 A1A1 N2
[2 marks]
Examiners report
This question was answered successfully by a majority of candidates. A common error was to use values of 20 and 60 for the lower and upper quartiles. Some were careless when reading the graph scale and wrote incorrect answers as a result.
This question was answered successfully by a majority of candidates. A common error was to use values of 20 and 60 for the lower and upper quartiles. Some were careless when reading the graph scale and wrote incorrect answers as a result.
This question was answered successfully by a majority of candidates. A common error was to use values of 20 and 60 for the lower and upper quartiles. Some were careless when reading the graph scale and wrote incorrect answers as a result.