| Date | May 2014 | Marks available | 2 | Reference code | 14M.1.sl.TZ2.3 |
| Level | SL only | Paper | 1 | Time zone | TZ2 |
| Command term | Find | Question number | 3 | Adapted from | N/A |
Question
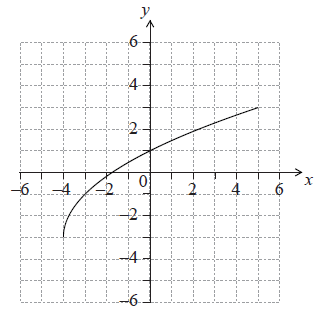
The following diagram shows the graph of \(y = f(x)\), for \( - 4 \le x \le 5\).

Write down the value of \(f( - 3)\).
Write down the value of \({f^{ - 1}}(1)\).
Find the domain of \({f^{ - 1}}\).
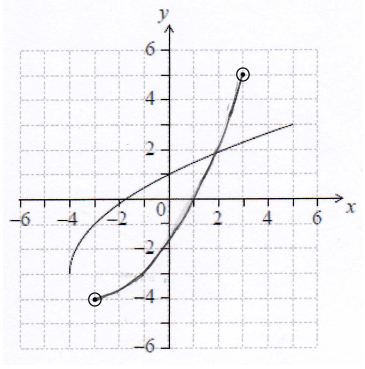
On the grid above, sketch the graph of \({f^{ - 1}}\).
Markscheme
\(f( - 3) = - 1\) A1 N1
[1 mark]
\({f^{ - 1}}(1) = 0\) (accept \(y = 0\)) A1 N1
[1 mark]
domain of \({f^{ - 1}}\) is range of \(f\) (R1)
eg \({\text{R}}f = {\text{D}}{f^{ - 1}}\)
correct answer A1 N2
eg \( - 3 \leqslant x \leqslant 3,{\text{ }}x \in [ - 3,{\text{ }}3]{\text{ (accept }} - 3 < x < 3,{\text{ }} - 3 \leqslant y \leqslant 3)\)
[2 marks]
 A1A1 N2
Note: Graph must be approximately correct reflection in \(y = x\).
Only if the shape is approximately correct, award the following:
A1 for x-intercept at \(1\), and A1 for endpoints within circles.
[2 marks]

