| Date | May 2017 | Marks available | 2 | Reference code | 17M.2.sl.TZ2.3 |
| Level | SL only | Paper | 2 | Time zone | TZ2 |
| Command term | Write down | Question number | 3 | Adapted from | N/A |
Question
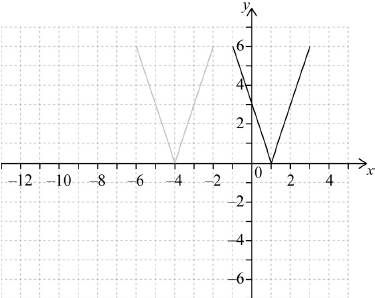
The following diagram shows the graph of a function \(y = f(x)\), for \( - 6 \leqslant x \leqslant - 2\).
The points \(( - 6,{\text{ }}6)\) and \(( - 2,{\text{ }}6)\) lie on the graph of \(f\). There is a minimum point at \(( - 4,{\text{ }}0)\).

Let \(g(x) = f(x - 5)\).
Write down the range of \(f\).
On the grid above, sketch the graph of \(g\).
Write down the domain of \(g\).
Markscheme
correct interval A2 N2
eg\(\,\,\,\,\,\)\(0 \leqslant y \leqslant 6,{\text{ }}[0,{\text{ }}6]\), from 0 to 6
[2 marks]
 M1A1 N2
Note: Award M1 for a horizontal shift of the whole shape, 5 units to the left or right and A1 for the correct graph.
[2 marks]
correct interval A2 N2
eg\(\,\,\,\,\,\)\( - 1 \leqslant x \leqslant 3,{\text{ }}[ - 1,{\text{ }}3]\), from \( - 1\) to 3
[2 marks]