| Date | November 2017 | Marks available | 1 | Reference code | 17N.1.SL.TZ0.T_5 |
| Level | Standard Level | Paper | Paper 1 (with calculator from previous syllabus) | Time zone | Time zone 0 |
| Command term | Question number | T_5 | Adapted from | N/A |
Question
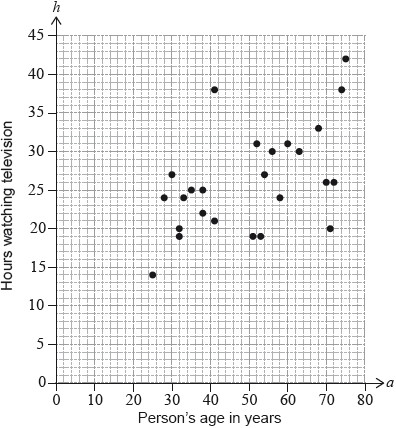
A survey was carried out to investigate the relationship between a person’s age in years ( ) and the number of hours they watch television per week (). The scatter diagram represents the results of the survey.

The mean age of the people surveyed was 50.
For these results, the equation of the regression line on is .
Find the mean number of hours that the people surveyed watch television per week.
Draw the regression line on the scatter diagram.
By placing a tick (✔) in the correct box, determine which of the following statements is true:

Diogo is 18 years old. Give a reason why the regression line should not be used to estimate the number of hours Diogo watches television per week.
Markscheme
* This question is from an exam for a previous syllabus, and may contain minor differences in marking or structure.
(M1)
Note: Award (M1) for correct substitution of 50 into equation of the regression line.
(A1) (C2)
OR
(M1)
Note: Award (M1) for correctly summing the values of the points, and dividing by 25.
(A1) (C2)
[2 marks]
line through and (A1)(ft)(A1) (C2)
Note: Award (A1)(ft) for a straight line through (50, their ), and (A1) for the line intercepting the -axis at ; this may need to be extrapolated. Follow through from part (a). Award at most (A0)(A1) if the line is not drawn with a ruler.
[2 marks]
 (A1) (C1)
Note: Award (A0) if more than one tick (✔) is seen.
[1 mark]
18 is less than the lowest age in the survey OR extrapolation. (A1) (C1)
Note: Accept equivalent statements.
[1 mark]

