| Date | May 2017 | Marks available | 1 | Reference code | 17M.2.SL.TZ2.S_2 |
| Level | Standard Level | Paper | Paper 2 | Time zone | Time zone 2 |
| Command term | Write down | Question number | S_2 | Adapted from | N/A |
Question
The maximum temperature , in degrees Celsius, in a park on six randomly selected days is shown in the following table. The table also shows the number of visitors, , to the park on each of those six days.
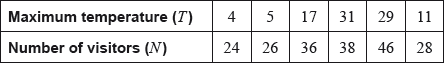
The relationship between the variables can be modelled by the regression equation .
Find the value of and of .
Write down the value of .
Use the regression equation to estimate the number of visitors on a day when the maximum temperature is 15 °C.
Markscheme
evidence of set up (M1)
egcorrect value for or
0.667315, 22.2117
A1A1 N3
[3 marks]
0.922958
A1 N1
[1 marks]
valid approach (M1)
eg
32.2214 (A1)
32 (visitors) (must be an integer) A1 N2
[3 marks]
Examiners report
Syllabus sections
-
22M.1.SL.TZ1.3b.ii:
Find the mean age of all the adults surveyed.
-
18M.3.AHL.TZ0.Hsp_4a:
State suitable hypotheses to investigate whether or not a negative linear association exists between X and Y.
-
18M.3.AHL.TZ0.Hsp_4b.ii:
State your conclusion at the 1 % significance level.
-
18M.2.SL.TZ2.S_1a.ii:
Write down the correlation coefficient.
-
17M.1.SL.TZ1.S_4a.i:
Write down the independent variable.
-
17M.1.SL.TZ1.S_4a.ii:
Write down the boiling temperature of the liquid.
-
18M.2.SL.TZ2.S_1a.i:
Find the value of a and of b.
-
16N.2.SL.TZ0.T_1h:
Write down a reason why this estimate is not reliable.
-
17N.1.SL.TZ0.T_5d:
Diogo is 18 years old. Give a reason why the regression line should not be used to estimate the number of hours Diogo watches television per week.
-
18M.1.SL.TZ2.T_1b:
Draw the line of best fit, by eye, on the scatter diagram.
-
19M.2.SL.TZ1.T_1f:
Draw the regression line on on the scatter diagram.
-
18N.2.SL.TZ0.T_1a.ii:
Use your graphic display calculator to write down , the mean examination score.
-
18N.2.SL.TZ0.T_1c.i:
Use the regression line y on x to estimate Jerome’s examination score.
-
18M.1.SL.TZ1.T_4b:
Using the equation of the regression line, estimate the concentration of dissolved oxygen in the river when the temperature is 18 °C.
-
18M.2.SL.TZ2.S_1b:
Use your equation to estimate the mean weight of a child that is 1.95 years old.
-
17N.2.SL.TZ0.S_8c:
Write down the number of low production hives.
-
18N.2.SL.TZ0.S_2a.ii:
Write down the correlation coefficient.
-
19M.2.SL.TZ2.S_1a.ii:
Find the correlation coefficient.
-
SPM.2.SL.TZ0.5b:
Let L2 be the regression line of y on x. The lines L1 and L2 pass through the same point with coordinates (p , q).
Find the value of p and the value of q.
-
17N.1.SL.TZ0.T_5c:
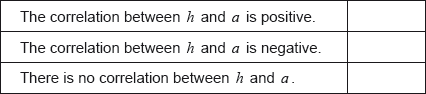
By placing a tick (✔) in the correct box, determine which of the following statements is true:
-
19M.2.SL.TZ1.T_1b.ii:
Write down, for this set of data the mean number of heartbeats per minute, .
-
SPM.2.AHL.TZ0.4c:
Jennifer was absent for the first test but scored 29 marks on the second test. Use an appropriate regression equation to estimate Jennifer’s mark on the first test.
-
18M.1.SL.TZ2.T_1a:
Plot and label the point M on the scatter diagram.
-
18N.2.SL.TZ0.S_2b:
Another athlete on this sports team has a hand length of 21.5 cm. Use the regression equation to estimate the height of this athlete.
-
18N.2.SL.TZ0.S_2a.i:
Find the value of a and of b.
-
SPM.2.AHL.TZ0.4a:
Find the value of a and the value of b.
-
SPM.2.SL.TZ0.5a:
Find the value of a and the value of b.
-
19M.2.SL.TZ1.T_1d.i:
Use your graphic display calculator to find the Pearson’s product–moment correlation coefficient, .
-
17M.2.SL.TZ1.T_1b.i:
For the data from these seven species calculate , the Pearson’s product–moment correlation coefficient;
-
SPM.2.AHL.TZ0.4b:
Find the value of p and the value of q.
-
17N.2.SL.TZ0.S_8e:
Adam decides to increase the number of bees in each low production hive. Research suggests that there is a probability of 0.75 that a low production hive becomes a regular production hive. Calculate the probability that 30 low production hives become regular production hives.
-
18N.2.SL.TZ0.T_1a.iii:
Use your graphic display calculator to write down r , Pearson’s product–moment correlation coefficient.
-
17N.2.SL.TZ0.S_8d.ii:
Find the number of hives that have a high production.
-
19N.3.AHL.TZ0.Hsp_1a.ii:
Carry out a suitable test at the 5 % significance level. With reference to the -value, state your conclusion in the context of Peter’s claim.
-
21N.2.AHL.TZ0.1d:
Lucy asserts that the number of hours a student practises has a direct effect on their final diploma result. Comment on the validity of Lucy’s assertion.
-
17N.2.SL.TZ0.S_8a:
Write down the value of and of .
-
17M.2.SL.TZ1.T_1b.ii:
For the data from these seven species describe the correlation between the average body weight and the average weight of the brain.
-
22M.1.SL.TZ1.3b.i:
One of the adults surveyed is years old. Estimate the age of their eldest child.
-
20N.2.SL.TZ0.S_2a.ii:
Write down the correlation coefficient.
-
EXN.2.SL.TZ0.4d:
A ‐year‐old male patient enters the medical clinic for his appointment.
Explain why the regression equation from part (b) should not be used to predict this patient’s systolic blood pressure.
-
EXN.2.SL.TZ0.4c:
Use the regression equation from part (b) to predict this patient’s systolic blood pressure.
-
19M.2.SL.TZ1.S_5b:
Use the model to predict how many edge pieces she had found when she had sorted a total of 750 pieces.
-
21M.2.SL.TZ1.2d:
Draw the line of best fit on the scatter diagram.
-
21M.2.SL.TZ1.2b:
Use this model to predict the value of when .
-
21M.2.SL.TZ1.2a:
Write down the value of and the value of .
-
21M.2.SL.TZ1.2c:
Write down the value of and the value of .
-
20N.2.SL.TZ0.S_2a.i:
Find the value of and of .
-
21M.2.SL.TZ2.1a.i:
Find the value of and the value of .
-
19M.2.SL.TZ2.S_1b:
Use the regression equation to estimate the BMI of an adult man whose waist size is 95 cm.
-
21M.2.SL.TZ2.1c:
On another day, Sarah visits the café to order a coffee. Seven customers have already ordered their coffee and are waiting to receive it.
Use the result from part (a)(i) to estimate Sarah’s waiting time to receive her coffee.
-
18M.2.SL.TZ1.S_8b:
Use the regression equation to estimate the value of y when x = 3.57.
-
19M.2.SL.TZ1.T_1c:
Plot and label the point M(, ) on the scatter diagram.
-
19N.2.SL.TZ0.S_1b:
Use your regression equation to predict the number of messages sent by a teenager that spent minutes talking on their phone in October.
-
17M.2.SL.TZ2.S_2b:
Use the regression equation to estimate the number of visitors on a day when the maximum temperature is 15 °C.
-
17N.2.SL.TZ0.S_8d.i:
Find the value of ;
-
18M.2.SL.TZ1.S_8a:
Find the value of a and of b.
-
19M.2.SL.TZ1.T_1e:
Use your graphic display calculator to find the equation of the regression line on .
-
21M.2.SL.TZ2.1a.ii:
Write down the value of Pearson’s product-moment correlation coefficient, .
-
19M.2.SL.TZ1.S_5a:
Write down the value of and of .
-
21N.2.AHL.TZ0.1c:
One of these eight students was disappointed with her result and wished she had practised more. Based on the given data, determine how her score could have been expected to alter had she practised an extra five hours per week.
-
21N.2.SL.TZ0.1c:
One of these eight students was disappointed with her result and wished she had practised more. Based on the given data, determine how her score could have been expected to alter had she practised an extra five hours per week.
-
18M.1.SL.TZ2.T_1c:
Using your line of best fit, estimate the physics test score for a student with a score of 20 in their mathematics test.
-
19M.2.SL.TZ1.T_1d.ii:
Hence describe the correlation between temperature difference from 37 °C and heartbeat.
-
18M.1.SL.TZ1.T_4a.ii:
For these data, find the equation of the regression line y on x.
-
19M.1.SL.TZ2.T_2b:
Draw the regression line of on on the scatter diagram.
-
19M.2.SL.TZ1.T_1a:
Draw a scatter diagram for temperature difference from 37 °C () against heartbeat (). Use a scale of 2 cm for 0.1 °C on the horizontal axis, starting with −0.3 °C. Use a scale of 1 cm for 2 heartbeats per minute on the vertical axis, starting with 60 beats per minute.
-
17M.2.SL.TZ2.T_3b.i:
Write down, for this set of data the mean number of folders produced, ;
-
19M.1.SL.TZ2.T_2c:
In order to estimate the amount of oxygen consumed, this regression line is considered to be reliable for a temperature such that ≤ ≤ .
Write down the value of and of .
-
16N.2.SL.TZ0.T_1c:
Plot the point on your scatter diagram and label this point M.
-
19M.2.SL.TZ1.T_1b.i:
Write down, for this set of data the mean temperature difference from 37 °C, .
-
16N.2.SL.TZ0.T_1e:
Write down the equation of the regression line on for these eight male students.
-
17M.2.SL.TZ2.T_3b.ii:
Write down, for this set of data the mean production cost, .
-
18N.2.SL.TZ0.T_1a.i:
Use your graphic display calculator to write down , the mean project mark.
-
18M.3.AHL.TZ0.Hsp_4c.ii:
Hence show that if U, V are independent random variables then the population product moment correlation coefficient, ρ, is zero.
-
17M.2.SL.TZ2.S_2a.i:
Find the value of and of .
-
17M.2.SL.TZ2.T_3f:
Use your graphic display calculator to find the equation of the regression line on .
-
19N.3.AHL.TZ0.Hsp_1a.i:
State suitable hypotheses and to test Peter’s claim, using a two-tailed test.
-
19M.2.SL.TZ2.S_1a.i:
Write down the value of and of .
-
17M.1.SL.TZ1.S_4b:
Jim describes the correlation as very strong. Circle the value below which best represents the correlation coefficient.
-
17M.1.SL.TZ1.S_4c:
Jim’s model is , for . Use his model to predict the decrease in temperature for any 2 minute interval.
-
EXN.2.SL.TZ0.4a.ii:
Interpret, in context, the value of found in part (a) (i).
-
EXN.2.SL.TZ0.4b:
Find the equation of the regression line of on .
-
18M.2.SL.TZ1.S_8c:
The relationship between x and y can be modelled using the formula y = kxn, where k ≠ 0 , n ≠ 0 , n ≠ 1.
By expressing ln y in terms of ln x, find the value of n and of k.
-
18M.3.AHL.TZ0.Hsp_4b.i:
Determine the p-value.
-
17N.2.SL.TZ0.S_8b:
Use this regression line to estimate the monthly honey production from a hive that has 270 bees.
-
21M.2.SL.TZ2.1b:
Interpret, in context, the value of found in part (a)(i).
-
19N.3.AHL.TZ0.Hsp_1b:
Peter uses the regression line of on as and calculates that a student with a Mathematics test score of 73 will have a running time of 101 seconds. Comment on the validity of his calculation.
-
19N.2.SL.TZ0.S_1a:
Write down the value of and of .
-
18M.3.AHL.TZ0.Hsp_4c.i:
Show that Cov(U, V) = E(UV) − E(U)E(V).
-
20N.2.SL.TZ0.S_2b:
Using the regression equation, estimate the number of hot chocolates that Lucy will sell on a day when the maximum temperature is .
-
EXN.2.SL.TZ0.4a.i:
Determine the value of Pearson’s product‐moment correlation coefficient, , for these data.
-
21N.2.AHL.TZ0.1b:
The relationship between the variables can be modelled by the regression equation . Write down the value of and the value of .
-
18N.2.SL.TZ0.T_1b.i:
Find the exact value of m and of c for these data.
-
18M.1.SL.TZ1.T_4a.i:
For these data, find Pearson’s product-moment correlation coefficient, r.
-
16N.2.SL.TZ0.T_1d:
Write down the value of , the Pearson’s product–moment correlation coefficient, for these data.
-
17M.2.SL.TZ2.T_3a:
Draw a scatter diagram for this data. Use a scale of 2 cm for 5000 folders on the horizontal axis and 2 cm for 10 000 Euros on the vertical axis.
-
17M.2.SL.TZ2.T_3d:
Use your graphic display calculator to find the Pearson’s product–moment correlation coefficient, .
-
17N.1.SL.TZ0.T_5a:
Find the mean number of hours that the people surveyed watch television per week.
-
19M.1.SL.TZ2.T_2a:
Find the equation of the regression line of on .
-
21N.2.SL.TZ0.1b:
The relationship between the variables can be modelled by the regression equation . Write down the value of and the value of .
-
18N.2.SL.TZ0.T_1b.ii:
Show that the point M (, ) lies on the regression line y on x.
-
17N.1.SL.TZ0.T_5b:
Draw the regression line on the scatter diagram.
-
21N.2.SL.TZ0.1a:
Find Pearson’s product-moment correlation coefficient, , for these data.
-
21N.2.AHL.TZ0.1a:
Find Pearson’s product-moment correlation coefficient, , for these data.
-
21N.2.AHL.TZ0.1e:
Lucy suspected that each student had not been practising as much as they reported. In order to compensate for this, Lucy deducted a fixed number of hours per week from each of the students’ recorded hours.
State how, if at all, the value of would be affected.
-
17M.2.SL.TZ1.T_1a:
Find the range of the average body weights for these seven species of mammal.
-
17M.2.SL.TZ1.T_1c:
Write down the equation of the regression line on , in the form .
-
17M.2.SL.TZ1.T_1d:
Use your regression line to estimate the average weight of the brain of grey wolves.
-
17M.2.SL.TZ1.T_1e:
Find the percentage error in your estimate in part (d).
-
17M.2.SL.TZ1.T_1f:
State whether it is valid to use the regression line to estimate the average weight of the brain of mice. Give a reason for your answer.
-
18N.2.SL.TZ0.T_1c.ii:
Justify whether it is valid to use the regression line y on x to estimate Jerome’s examination score.
-
18N.2.SL.TZ0.T_1d:
In his final IB examination Jerome scored 65.
Calculate the percentage error in Jerome’s estimated examination score.
-
16N.2.SL.TZ0.T_1a:
On graph paper, draw a scatter diagram for these data. Use a scale of 2 cm to represent 5 hours on the -axis and 2 cm to represent 10 points on the -axis.
-
16N.2.SL.TZ0.T_1b:
(i) , the mean number of hours spent on social media;
(ii) , the mean number of IB Diploma points.
-
16N.2.SL.TZ0.T_1f:
Draw the regression line, from part (e), on your scatter diagram.
-
16N.2.SL.TZ0.T_1g:
Use the given equation of the regression line to estimate the number of IB Diploma points that this girl obtained.
-
17M.2.SL.TZ2.T_3c:
Label the point on the scatter diagram.
-
17M.2.SL.TZ2.T_3e:
State a reason why the regression line on is appropriate to model the relationship between these variables.
-
17M.2.SL.TZ2.T_3g:
Draw the regression line on on the scatter diagram.
-
17M.2.SL.TZ2.T_3h:
Use the equation of the regression line to estimate the least number of folders that the factory needs to sell in a month to exceed its production cost for that month.