| Date | May 2018 | Marks available | 1 | Reference code | 18M.2.HL.TZ2.5 |
| Level | Higher level | Paper | Paper 2 | Time zone | 2 |
| Command term | Sketch | Question number | 5 | Adapted from | N/A |
Question
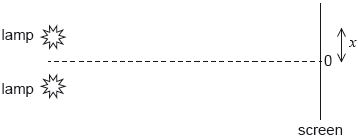
Monochromatic light from two identical lamps arrives on a screen.

The intensity of light on the screen from each lamp separately is I0.
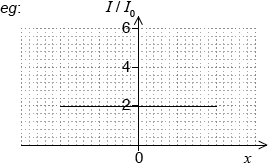
On the axes, sketch a graph to show the variation with distance x on the screen of the intensity I of light on the screen.
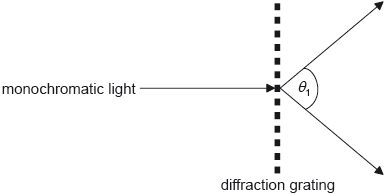
Monochromatic light from a single source is incident on two thin, parallel slits.

The following data are available.
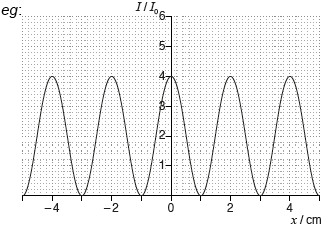
The intensity I of light at the screen from each slit separately is I0. Sketch, on the axes, a graph to show the variation with distance x on the screen of the intensity of light on the screen for this arrangement.
The slit separation is increased. Outline one change observed on the screen.
Markscheme
horizontal straight line through I = 2

Accept a curve that falls from I = 2 as distance increases from centre but not if it falls to zero.
[1 mark]
«standard two slit pattern»
general shape with a maximum at x = 0
maxima at 4I0
maxima separated by « =» 2.0 cm
Accept single slit modulated pattern provided central maximum is at 4. ie height of peaks decrease as they go away from central maximum. Peaks must be of the same width

[3 marks]
fringe width/separation decreases
OR
more maxima seen
[1 mark]


