| Date | May 2014 | Marks available | 2 | Reference code | 14M.2.sl.TZ1.1 |
| Level | SL only | Paper | 2 | Time zone | TZ1 |
| Command term | Estimate | Question number | 1 | Adapted from | N/A |
Question
As part of his IB Biology field work, Barry was asked to measure the circumference of trees, in centimetres, that were growing at different distances, in metres, from a river bank. His results are summarized in the following table.
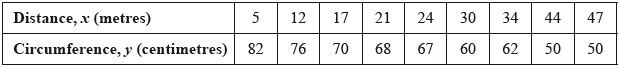
State whether distance from the river bank is a continuous or discrete variable.
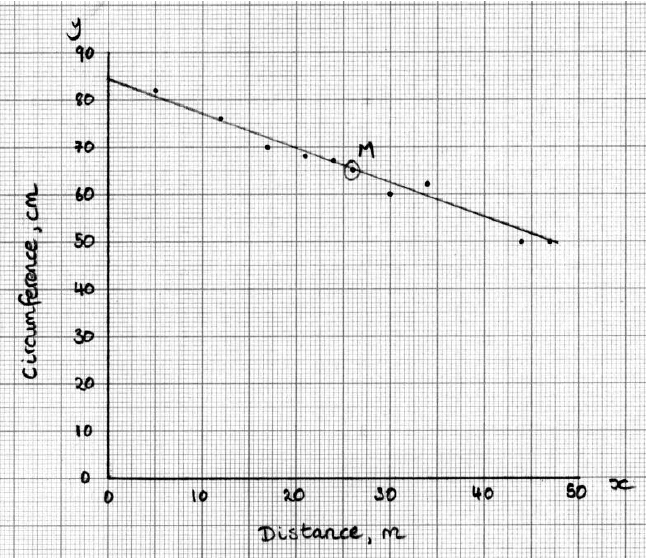
On graph paper, draw a scatter diagram to show Barry’s results. Use a scale of 1 cm to represent 5 m on the x-axis and 1 cm to represent 10 cm on the y-axis.
Write down
(i) the mean distance, \(\bar x\), of the trees from the river bank;
(ii) the mean circumference, \(\bar y\), of the trees.
Plot and label the point \({\text{M}}(\bar x,{\text{ }}\bar y)\) on your graph.
Write down
(i) the Pearson’s product–moment correlation coefficient, \(r\), for Barry’s results;
(ii) the equation of the regression line \(y\) on \(x\), for Barry’s results.
Draw the regression line \(y\) on \(x\) on your graph.
Use the equation of the regression line \(y\) on \(x\) to estimate the circumference of a tree that is 40 m from the river bank.
Markscheme
continuous (A1)
[1 mark]
 (A1)(A1)(A1)(A1)
Notes: Award (A1) for labelled axes and correct scales; if axes are reversed award (A0) and follow through for their points. Award (A1) for at least 3 correct points, (A2) for at least 6 correct points, (A3) for all 9 correct points. If scales are too small or graph paper has not been used, accuracy cannot be determined; award (A0). Do not penalize if extra points are seen.
[4 marks]
(i) 26 (m) (A1)
(ii) 65 (cm) (A1)
[2 marks]
point \({\text{M}}\) labelled, in correct position (A1)(A1)(ft)
Notes: Award (A1)(ft) for point plotted in correct position, (A1) for point labelled \({\text{M}}\) or \((\bar x,{\text{ }}\bar y)\). Follow through from their answers to part (c).
[2 marks]
(i) \(-0.988\;{\text{ }}\left( {-0.988432 \ldots } \right)\) (G2)
Note: Award (G2) for \(-0.99\). Award (G1) for \(-0.990\).
Award (A1)(A0) if minus sign is omitted.
(ii) \(y = - 0.756x + 84.7\) \((y = - 0.756281 \ldots x + 84.6633 \ldots )\) (G2)
Notes: Award (A1) for \( - 0.756x\), (A1) for \(84.7\). If the answer is not given as an equation, award a maximum of (A1)(A0).
[4 marks]
regression line through their \({\text{M}}\) (A1)((ft)
regression line through their \(\left( {0,85} \right)\) (accept \(85 \pm 1\)) (A1)(ft)
Notes: Follow through from part (d). Award a maximum of (A1)(A0) if the line is not straight. Do not penalize if either the line does not meet the y-axis or extends into quadrants other than the first.
If \({\text{M}}\) is not plotted or labelled, then follow through from part (c).
Follow through from their y-intercept in part (e)(ii).
[2 marks]
\( - 0.756281(40) + 84.6633\) (M1)
\( = 54.4{\text{ (cm) }}(54.4120 \ldots )\) (A1)(ft)(G2)
Notes: Accept \(54.5\) (\(54.46\)) for use of 3 sf. Accept \(54.3\) from use of \(-0.76\) and \(84.7\).
Follow through from their equation in part (e)(ii) irrespective of working shown; the final answer seen must be consistent with that equation for the final (A1) to be awarded.
Do not accept answers taken from the graph.
[2 marks]