| Date | May 2014 | Marks available | 2 | Reference code | 14M.1.sl.TZ2.12 |
| Level | SL only | Paper | 1 | Time zone | TZ2 |
| Command term | Find | Question number | 12 | Adapted from | N/A |
Question
A survey investigated the relationship between the number of cleaners, \(n\), and the amount of time, \(t\), it takes them to clean a school.
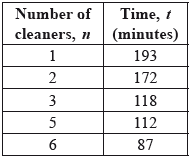
Use your graphic display calculator to write down the equation of the regression line \(t\) on \(n\).
Write down the value of the Pearson’s product–moment correlation coefficient, \(r\).
Use your regression equation to find the amount of time 4 cleaners take to clean the school.
Markscheme
\(t = - 20.1n + 205\)
\(t = (-20.1046 \ldots )n + (204.755 \ldots )\) (A1)(A1) (C2)
Notes: Award (A1) for \(-20.1\) and \(205\) seen,
(A1) for an equation involving \(t\) and \(n\).
[2 marks]
\(-0.941 (-0.941366…)\) (A2) (C2)
Notes: Award (A0)(A1) for \( +0.941\).
[2 marks]
\(-20.1046 \ldots \times 4 + 204.755 \ldots \) (M1)
Note: Award (M1) for substitution into their regression equation.
\(124\) (minutes) (\(124.337…\)) (A1)(ft) (C2)
Notes: Follow through from their regression equation found in part (a). Accept \(125\) (minutes) (\(124.6\)).
[2 marks]