| Date | November 2012 | Marks available | 6 | Reference code | 12N.2.bp.8 |
| Level | SL and HL | Paper | 2 | Time zone | |
| Command term | Explain | Question number | 8 | Adapted from | N/A |
Question
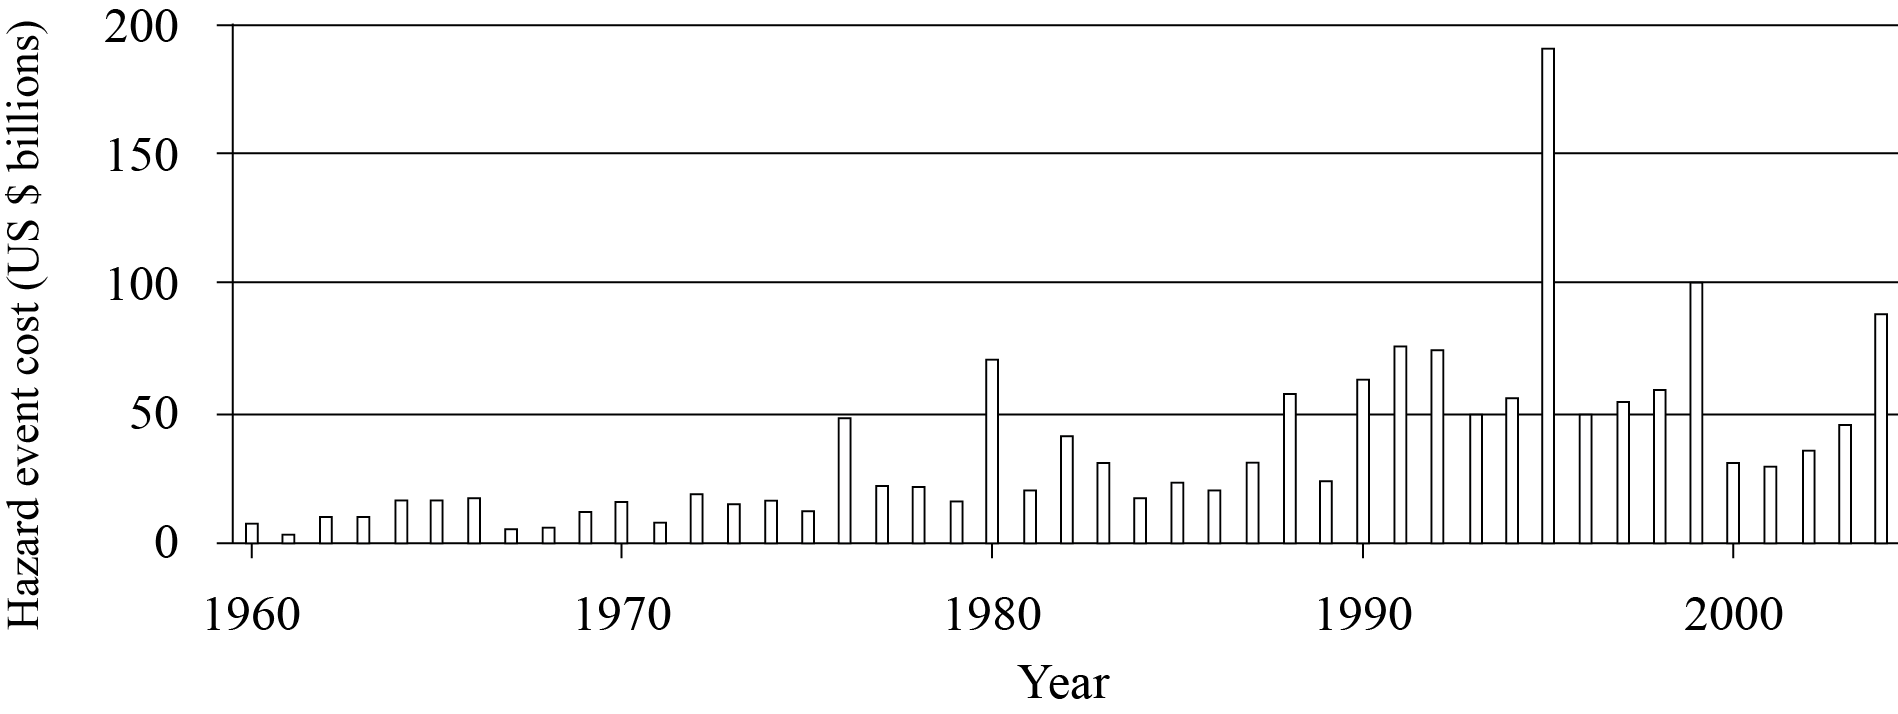
The graph shows the cost of hazard events worldwide in US dollars from 1960 to 2004.

[Source: NASA Earth Observatory, http://earthobservatory.nasa.gov/Features/RisingCost/]
Describe the changes shown in the graph.
Explain the reasons for the changes shown in the graph.
Examine the different types of responses that occurred during and after a named disaster. (Do not refer to technological hazards in your answer.)
Markscheme
Award [1 mark] for each valid statement supported by evidence from the graph including dates and costs. Possible answers include:
- a general upward trend in the cost of hazard events (e.g. no events costing over $25 billion before 1975, many events costing over $50 billion after 1988)
- but not a simple rise – there are fluctuations
- identification of major anomalies/cost events (Kobe, Indian Ocean tsunami)
- fall in 2000s compared with 1990s
- there may be other creditable points.
Answers could refer to:
- people have more possessions and more valuable possessions over time
- the increasing value of property and infrastructure over time
- more people are living in hazard prone areas.
Award [1 mark] for each valid reason; some development of each reason is expected for [2 marks]. Accept other valid reasons but they must include a clear explanation.
Answers that refer to an increase in the number or intensity of hazard events over time must give valid supporting evidence.
The disaster must be dated and located. How the event resulted in a disaster should be explained. The answer should refer to specific short-term (“during” as well as possibly before or immediate aftermath), medium-term and long-term responses (“after”) related to the actual hazard event.
Short-term responses might include: search and rescue, emergency medical assistance, provision of security, emergency shelter, food and water and the clearing of debris resulting from the hazard event. Medium-term responses might include: destruction of damaged buildings, restoration of services such as communications, health care, transport and retailing, the return of displaced persons and rehabilitation programmes. Long-term responses may include: reconstruction, planning for future hazard events in terms of emergency response systems, the introduction of measures to mitigate future impact on people and property, awareness education and hazard training, the development of warning systems and evacuation strategies where relevant.
There may be alternate approaches – such as an examination of the efforts made by different agencies (NGOs, governments, etc.) – and these should be credited. Answers that simply describe local responses to a hazard event, as opposed to a disaster requiring outside assistance should not move above band D. Answers that examine a range of responses may be credited at bands E and F. Responses that examine a disaster outside the scope of the syllabus (e.g. floods) should be marked on their merits.
Marks should be allocated according to the markbands.
Examiners report
The description of changes was generally done well, although weaker responses did not use the data on the graph.
Many simply referred to an increase in hazards due to climate change without any evidence, though most were able to relate increased affluence to rising costs. Surprisingly few referred to increased population living in hazard-prone areas.
A number of candidates concentrated on pre-disaster preparations, and whilst relevant to a certain extent, it meant that “during” and “after” were neglected. Some only concentrated on what was not done, for example in Cyclone Nargis, or moralizing about Hurricane Katrina rather than examining the facts. Some saw it as an excuse to write all they knew about a hazard event, with little reference to the question. A number used Chernobyl, oil rig or oil tanker disasters despite the instruction against this.
Stronger responses demonstrated good planning and setting out of the pattern of responses along with time frames and set up some good structure in logical sequence.

