| Date | May 2017 | Marks available | 2 | Reference code | 17M.2.SL.TZ2.S_8 |
| Level | Standard Level | Paper | Paper 2 | Time zone | Time zone 2 |
| Command term | Find | Question number | S_8 | Adapted from | N/A |
Question
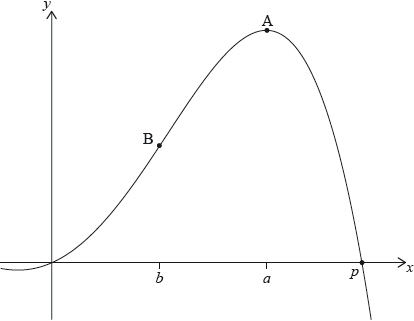
Let . The following diagram shows part of the graph of .

There are -intercepts at and at . There is a maximum at A where , and a point of inflexion at B where .
Find the value of .
Write down the coordinates of A.
Write down the rate of change of at A.
Find the coordinates of B.
Find the the rate of change of at B.
Let be the region enclosed by the graph of , the -axis, the line and the line . The region is rotated 360° about the -axis. Find the volume of the solid formed.
Markscheme
* This question is from an exam for a previous syllabus, and may contain minor differences in marking or structure.
evidence of valid approach (M1)
eg
2.73205
A1 N2
[2 marks]
1.87938, 8.11721
A2 N2
[2 marks]
rate of change is 0 (do not accept decimals) A1 N1
[1 marks]
METHOD 1 (using GDC)
valid approach M1
eg, max/min on
sketch of either or , with max/min or root (respectively) (A1)
A1 N1
Substituting their value into (M1)
eg
A1 N1
METHOD 2 (analytical)
A1
setting (M1)
A1 N1
substituting their value into (M1)
eg
A1 N1
[4 marks]
recognizing rate of change is (M1)
eg
rate of change is 6 A1 N2
[3 marks]
attempt to substitute either limits or the function into formula (M1)
involving (accept absence of and/or )
eg
128.890
A2 N3
[3 marks]

