| Date | May 2019 | Marks available | 2 | Reference code | 19M.3.SL.TZ2.1 |
| Level | Standard level | Paper | Paper 3 | Time zone | 2 |
| Command term | Outline | Question number | 1 | Adapted from | N/A |
Question
A student investigates the electromotive force (emf) ε and internal resistance r of a cell.
The current I and the terminal potential difference V are measured.
For this circuit V = ε - Ir .
The table shows the data collected by the student. The uncertainties for each measurement
are shown.
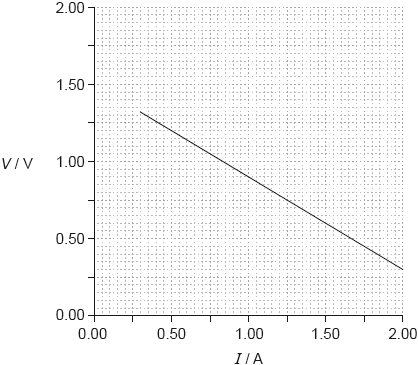
The graph shows the data plotted.
The student has plotted error bars for the potential difference. Outline why no error bars are shown for the current.
Determine, using the graph, the emf of the cell including the uncertainty for this value. Give your answer to the correct number of significant figures.
Outline, without calculation, how the internal resistance can be determined from this graph.
Markscheme
ΔI is too small to be shown/seen
OR
Error bar of negligible size compared to error bar in V ✔
evidence that ε can be determined from the y-intercept of the line of best-fit or lines of min and max gradient ✔
states ε=1.59 OR 1.60 OR 1.61V«» ✔
states uncertainty in ε is 0.02 V«» OR 0.03«V» ✔
determine the gradient «of the line of best-fit» ✔
r is the negative of this gradient ✔
Examiners report
Almost all candidates realised that the uncertainty in I was too small to be shown. A common mistake was to mention that since I is the independent variable the uncertainty is negligible.
The number of candidates who realised that the V intercept was EMF was disappointing. Large numbers of candidates tried to calculate ε using points on the graph, often ending up with unrealistic values. Another common mistake was not giving values of ε and Δε to the correct number of digits - 2 decimal places on this occasion. Very few candidates drew maximum and minimum gradient lines as a way of determining Δε.


