| Date | May 2018 | Marks available | 1 | Reference code | 18M.1.HL.TZ1.24 |
| Level | Higher level | Paper | Paper 1 | Time zone | Time zone 1 |
| Command term | Question number | 24 | Adapted from | N/A |
Question
The dashed line on the graph shows the variation with wavelength of the intensity of solar radiation before passing through the Earth’s atmosphere.
The solid line on the graph shows the variation with wavelength of the intensity of solar radiation after it has passed through the Earth’s atmosphere.
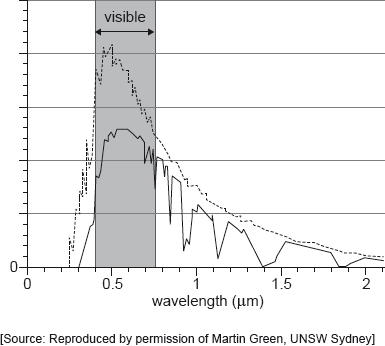
Which feature of the graph helps explain the greenhouse effect?
A. Infrared radiation is absorbed at specific wavelengths.
B. There is little absorption at infrared wavelengths.
C. There is substantial absorption at visible wavelengths.
D. There is little absorption at UV wavelengths.
Markscheme
A
Examiners report
[N/A]
Syllabus sections
Show 89 related questions
- 18M.1.SL.TZ2.30: Mars and Earth act as black bodies....
- 18M.1.SL.TZ2.29: Three gases in the atmosphere are I. carbon dioxide (CO2) II. ...
- 18M.2.SL.TZ1.6c.iii: Calculate the peak wavelength in the intensity of the radiation emitted by the ice sample.
- 18M.2.SL.TZ1.6c.ii: Discuss how the frequency of the radiation emitted by a black body can be used to estimate...
- 18M.2.SL.TZ1.6c.i: State what is meant by thermal radiation.
- 18M.1.SL.TZ1.30: The diagram shows a simple climate model for the Earth. What does this model predict for...
- 17N.2.SL.TZ0.5b.ii: Suggest how the difference between λS and λE helps to account for the greenhouse effect.
- 17N.2.SL.TZ0.5b.i: Determine the mean temperature of the Earth.
- 17N.1.SL.TZ0.29: The three statements give possible reasons why an average value should be used for the solar...
- 17N.1.SL.TZ0.28: A black body emits radiation with its greatest intensity at a wavelength of Imax. The...
- 17M.1.HL.TZ1.25: The average albedo of glacier ice is 0.25. What is...
- 17M.1.HL.TZ1.23: An object can lose energy through I. conductionII. convectionIII. radiation What are...
- 17M.1.SL.TZ2.29: A room is at a constant temperature of 300 K. A hotplate in the room is at a temperature of...
- 17M.1.SL.TZ1.30: The average surface temperature of Mars is approximately 200 K and the average surface...
- 17M.1.SL.TZ1.29: Planet X and planet Y both emit radiation as black bodies. Planet X has a surface temperature...
- 17M.1.SL.TZ1.15: Two pulses are travelling towards each other. What is a possible pulse shape when the...
- 16M.2.HL.TZ0.9d: The average surface temperature of the Earth is actually 288 K. Suggest how the greenhouse...
- 16M.2.SL.TZ0.7b: The albedo of the atmosphere is 0.30. Deduce that the average intensity over the entire...
- 16M.2.SL.TZ0.7a: Show that the intensity of the solar radiation incident on the upper atmosphere of the Earth...
- 16N.1.HL.TZ0.25: X and Y are two spherical black-body radiators that emit the same total power. The absolute...
- 16N.1.HL.TZ0.24: The solar constant is the intensity of the Sun’s radiation at A. the surface of the...
- 16M.1.SL.TZ0.30: A black body of surface 1.0m2 emits electromagnetic radiation of peak wavelength 2.90×10⁻⁶m....
- 15M.1.SL.TZ2.30: Methane and carbon dioxide are both greenhouse gases that are believed to cause global...
- 15M.1.HL.TZ2.36: The graph shows the variation with wavelength of intensity of radiation emitted by two bodies...
- 15M.1.HL.TZ2.37: Methane and carbon dioxide are both greenhouse gases that are believed to cause global...
- 14M.1.SL.TZ1.29: A uranium nuclear fission reactor that attempts to operate without a moderator would A....
- 14M.1.SL.TZ1.26: A black body has kelvin temperature T and surface area A. The total power radiated by the...
- 14M.1.SL.TZ1.28: The average intensity of the solar radiation incident on a planet is 200 W m–2. The albedo of...
- 14M.1.HL.TZ1.37: A body X of emissivity e is at temperature T1. X is inside a box whose walls act as a black...
- 14M.1.SL.TZ2.26: A black body has absolute temperature T and surface area A. The intensity of the radiation...
- 14M.1.SL.TZ2.29: The greenhouse effect can be explained by the fact that the infrared radiation emitted by the...
- 14M.1.HL.TZ2.35: A black body has absolute temperature T and surface area A. The intensity of the radiation...
- 14M.2.SL.TZ1.4a: State the Stefan-Boltzmann law for a black body.
- 14M.2.SL.TZ1.4b: Deduce that the solar power incident per unit area at distance d from the Sun is given...
- 14M.2.SL.TZ1.4d: State two reasons why the solar power incident per unit area at a point on the surface of the...
- 14M.2.SL.TZ1.4c: Calculate, using the data given, the solar power incident per unit area at distance d from...
- 14M.2.SL.TZ1.4e: The average power absorbed per unit area at the Earth’s surface is 240Wm–2. By treating the...
- 14M.2.SL.TZ1.4f: Explain why the actual surface temperature of the Earth is greater than the value in (e).
- 14M.2.HL.TZ1.6c: Calculate, using the data given, the solar power incident per unit area at distance d from...
- 14M.2.HL.TZ1.6f: Explain why the actual surface temperature of the Earth is greater than the value in (e).
- 14M.2.HL.TZ1.6b: Deduce that the solar power incident per unit area at distance d from the Sun is given...
- 14M.2.HL.TZ1.6d: State two reasons why the solar power incident per unit area at a point on the surface of the...
- 14M.2.HL.TZ1.6e: The average power absorbed per unit area at the Earth’s surface is 240Wm–2. By treating the...
- 14M.2.HL.TZ1.6a: State the Stefan-Boltzmann law for a black body.
- 15N.1.SL.TZ0.27: It is suggested that the solar power incident at a point on the Earth’s surface depends...
- 15N.1.SL.TZ0.29: The average surface temperature of Mars is about 200 K. The average surface temperature of...
- 14N.1.SL.TZ0.28: The graph shows the emission spectrum for a black body at absolute temperature T1. Which...
- 14N.1.HL.TZ0.36: Changes in the climate are leading to a reduction in ice cover on Earth. Which of the...
- 14N.1.HL.TZ0.37: The graph shows the emission spectrum for a black body at absolute temperature T1. Which...
- 11N.1.SL.TZO.28: Which of the following geographical features has the lowest albedo? A. Polar ice capB....
- 11N.1.SL.TZO.30: Which of the following alternatives would be the most likely to increase the enhanced...
- 12N.1.SL.TZ0.26: For a black-body at absolute temperature T the power emitted per unit area is P. What is the...
- 13N.1.SL.TZ0.29: The surface temperature of a black-body emitter is doubled. By what factor does the power...
- 13N.1.HL.TZ0.37: Which option is not a possible solution to reduce the enhanced greenhouse effect? A....
- 12M.1.SL.TZ2.29: Gases in the Earth’s atmosphere believed to be responsible for the greenhouse effect...
- 12M.1.SL.TZ1.28: Increasing the temperature of a black-body will have the following effect on its emission...
- 13M.2.SL.TZ1.8e: The intensity of the Sun’s radiation at the position of the Earth’s orbit (the solar...
- 13M.2.SL.TZ2.9c: The average solar intensity incident at the surface of the Earth is 238 W m–2. (i) Assuming...
- 11M.1.SL.TZ2.29: Surface X has a temperature TX and emissivity εx. Surface Y has a temperature TY and...
- 11M.1.SL.TZ2.30: Large areas of rainforests are...
- 13M.2.SL.TZ2.9b: Wind power does not involve the production of greenhouse gases. Outline why the surface...
- 11M.1.HL.TZ2.37: Which of the...
- 13M.1.SL.TZ2.29: The graph shows the spectrum of a black-body. Which graph shows the spectrum of a body of...
- 13M.1.SL.TZ2.25: The use of which energy source enhances the greenhouse effect the most? A. WoodB. CoalC....
- 13M.1.SL.TZ2.30: A student states that the following factors may lead to global warming I. decreased albedo...
- 12M.2.SL.TZ2.8c: The radiant power of the Sun is 3.90 ×1026W. The average radius of the Earth’s orbit about...
- 12M.2.SL.TZ2.8e: Assuming that the Earth’s surface behaves as a black-body and that no energy is absorbed by...
- 12M.2.SL.TZ2.8d: Show, using your answer to (c), that the average intensity incident on the Earth’s surface is...
- 12M.2.SL.TZ1.2a: Explain why the power absorbed by the Earth...
- 12M.2.SL.TZ1.2b: The equation in (a) leads to the following expression which can be used to predict the...
- 11N.2.SL.TZ0.8b: The graph shows the variation with frequency of the percentage transmittance of...
- 11N.2.SL.TZ0.8a: Describe what is meant by the greenhouse effect in the Earth’s atmosphere.
- 12N.2.SL.TZ0.7a: The Pobeda ice island forms regularly when icebergs run aground near the Antarctic ice shelf....
- 12N.2.SL.TZ0.7b: Suggest the likely effect on the average albedo of the region in which the island was...
- 13N.2.SL.TZ0.6f: Nuclear fuels, unlike fossil fuels, produce no greenhouse gases. (i) Identify two greenhouse...
- 11M.1.SL.TZ1.25: What is the phenomenon that best explains why greenhouse gases absorb infrared radiation? A....
- 11M.1.SL.TZ1.26: In which of the following places will the albedo be greatest? A. A forestB. A grasslandC. An...
- 11M.1.SL.TZ1.28: A spherical black body has absolute temperature T1. The surroundings are kept at a lower...
- 11M.2.SL.TZ1.9b: The diagram shows a simplified model of the energy balance of the Earth’s surface. The...
- 11M.2.SL.TZ1.9c: (i) Outline a mechanism by which part of the radiation radiated by the Earth’s surface is...
- 11M.2.SL.TZ1.9a: The intensity of the Sun’s radiation at the position of the Earth is approximately 1400 W...
- 09M.1.SL.TZ1.29: Greenhouse gases A. reflect infrared radiation but absorb ultraviolet radiation. B. ...
- 09M.1.SL.TZ1.30: The rate of global warming might be reduced by A. replacing the use of coal and oil with...
- 10N.1.SL.TZ0.28: The diagram shows the variation with wavelength of the power per unit wavelength \(I\)...
- 09N.1.SL.TZ0.28: Which of the following is likely to increase greenhouse gas concentrations in the...
- 10M.1.SL.TZ1.30: Which of the following is most likely to reduce the enhanced greenhouse effect? A. ...
- 10M.1.SL.TZ1.29: The albedo for the oceans is lower than that for glaciers. This is because, compared to ice,...
- 10N.1.SL.TZ0.30: The diagram shows an energy balance climate model for a planet. The intensities of the...
- 09N.1.SL.TZ0.29: Venus and Earth may be regarded as behaving as black bodies. The mean temperature at the...