| Date | November 2016 | Marks available | 2 | Reference code | 16N.2.sl.TZ0.8 |
| Level | SL only | Paper | 2 | Time zone | TZ0 |
| Command term | Find | Question number | 8 | Adapted from | N/A |
Question
Ten students were surveyed about the number of hours, \(x\), they spent browsing the Internet during week 1 of the school year. The results of the survey are given below.
\[\sum\limits_{i = 1}^{10} {{x_i} = 252,{\text{ }}\sigma = 5{\text{ and median}} = 27.} \]
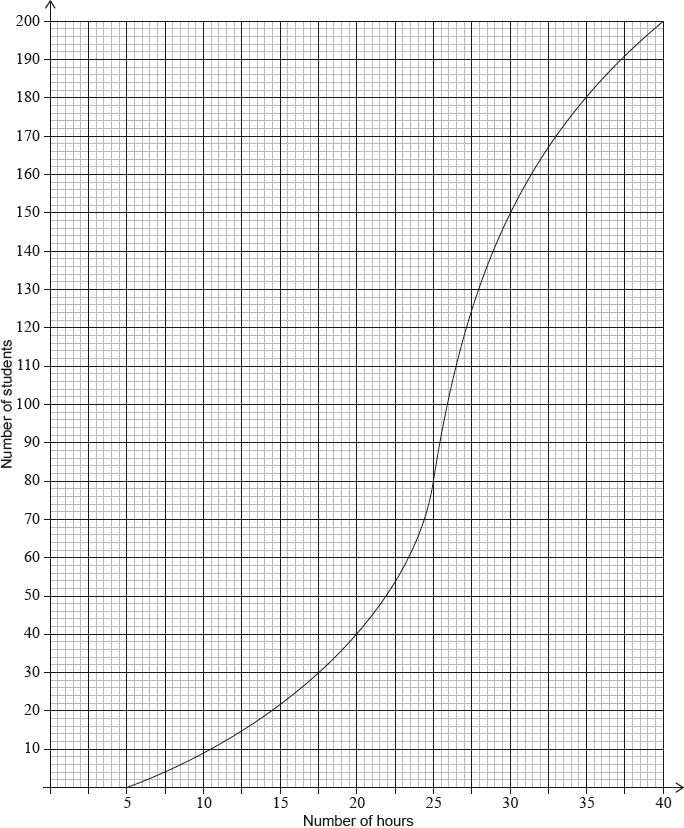
During week 4, the survey was extended to all 200 students in the school. The results are shown in the cumulative frequency graph:
Find the mean number of hours spent browsing the Internet.
During week 2, the students worked on a major project and they each spent an additional five hours browsing the Internet. For week 2, write down
(i) the mean;
(ii) the standard deviation.
During week 3 each student spent 5% less time browsing the Internet than during week 1. For week 3, find
(i) the median;
(ii) the variance.
(i) Find the number of students who spent between 25 and 30 hours browsing the Internet.
(ii) Given that 10% of the students spent more than k hours browsing the Internet, find the maximum value of \(k\).
Markscheme
attempt to substitute into formula for mean (M1)
eg\(\,\,\,\,\,\)\(\frac{{\Sigma x}}{{10}},{\text{ }}\frac{{252}}{n},{\text{ }}\frac{{252}}{{10}}\)
mean \( = 25.2{\text{ (hours)}}\) A1 N2
[2 marks]
(i) mean \( = 30.2{\text{ (hours)}}\) A1 N1
(ii) \(\sigma = 5{\text{ (hours)}}\) A1 N1
[2 marks]
(i) valid approach (M1)
eg\(\,\,\,\,\,\)95%, 5% of 27
correct working (A1)
eg\(\,\,\,\,\,\)\(0.95 \times 27,{\text{ }}27 - (5\% {\text{ of }}27)\)
median \( = 25.65{\text{ (exact), }}25.7{\text{ (hours)}}\) A1 N2
(ii) METHOD 1
variance \( = {({\text{standard deviation}})^2}\) (seen anywhere) (A1)
valid attempt to find new standard deviation (M1)
eg\(\,\,\,\,\,\)\({\sigma _{new}} = 0.95 \times 5,{\text{ }}4.75\)
variance \( = 22.5625{\text{ }}({\text{exact}}),{\text{ }}22.6\) A1 N2
METHOD 2
variance \( = {({\text{standard deviation}})^2}\) (seen anywhere) (A1)
valid attempt to find new variance (M1)
eg\(\,\,\,\,\,\)\({0.95^2}{\text{ }},{\text{ }}0.9025 \times {\sigma ^2}\)
new variance \( = 22.5625{\text{ }}({\text{exact}}),{\text{ }}22.6\) A1 N2
[6 marks]
(i) both correct frequencies (A1)
eg\(\,\,\,\,\,\)80, 150
subtracting their frequencies in either order (M1)
eg\(\,\,\,\,\,\)\(150 - 80,{\text{ }}80 - 150\)
70 (students) A1 N2
(ii) evidence of a valid approach (M1)
eg\(\,\,\,\,\,\)10% of 200, 90%
correct working (A1)
eg\(\,\,\,\,\,\)\(0.90 \times 200,{\text{ }}200 - 20\), 180 students
\(k = 35\) A1 N3
[6 marks]