| Date | November 2012 | Marks available | 4 | Reference code | 12N.2.bp.11 |
| Level | SL and HL | Paper | 2 | Time zone | |
| Command term | Describe | Question number | 11 | Adapted from | N/A |
Question
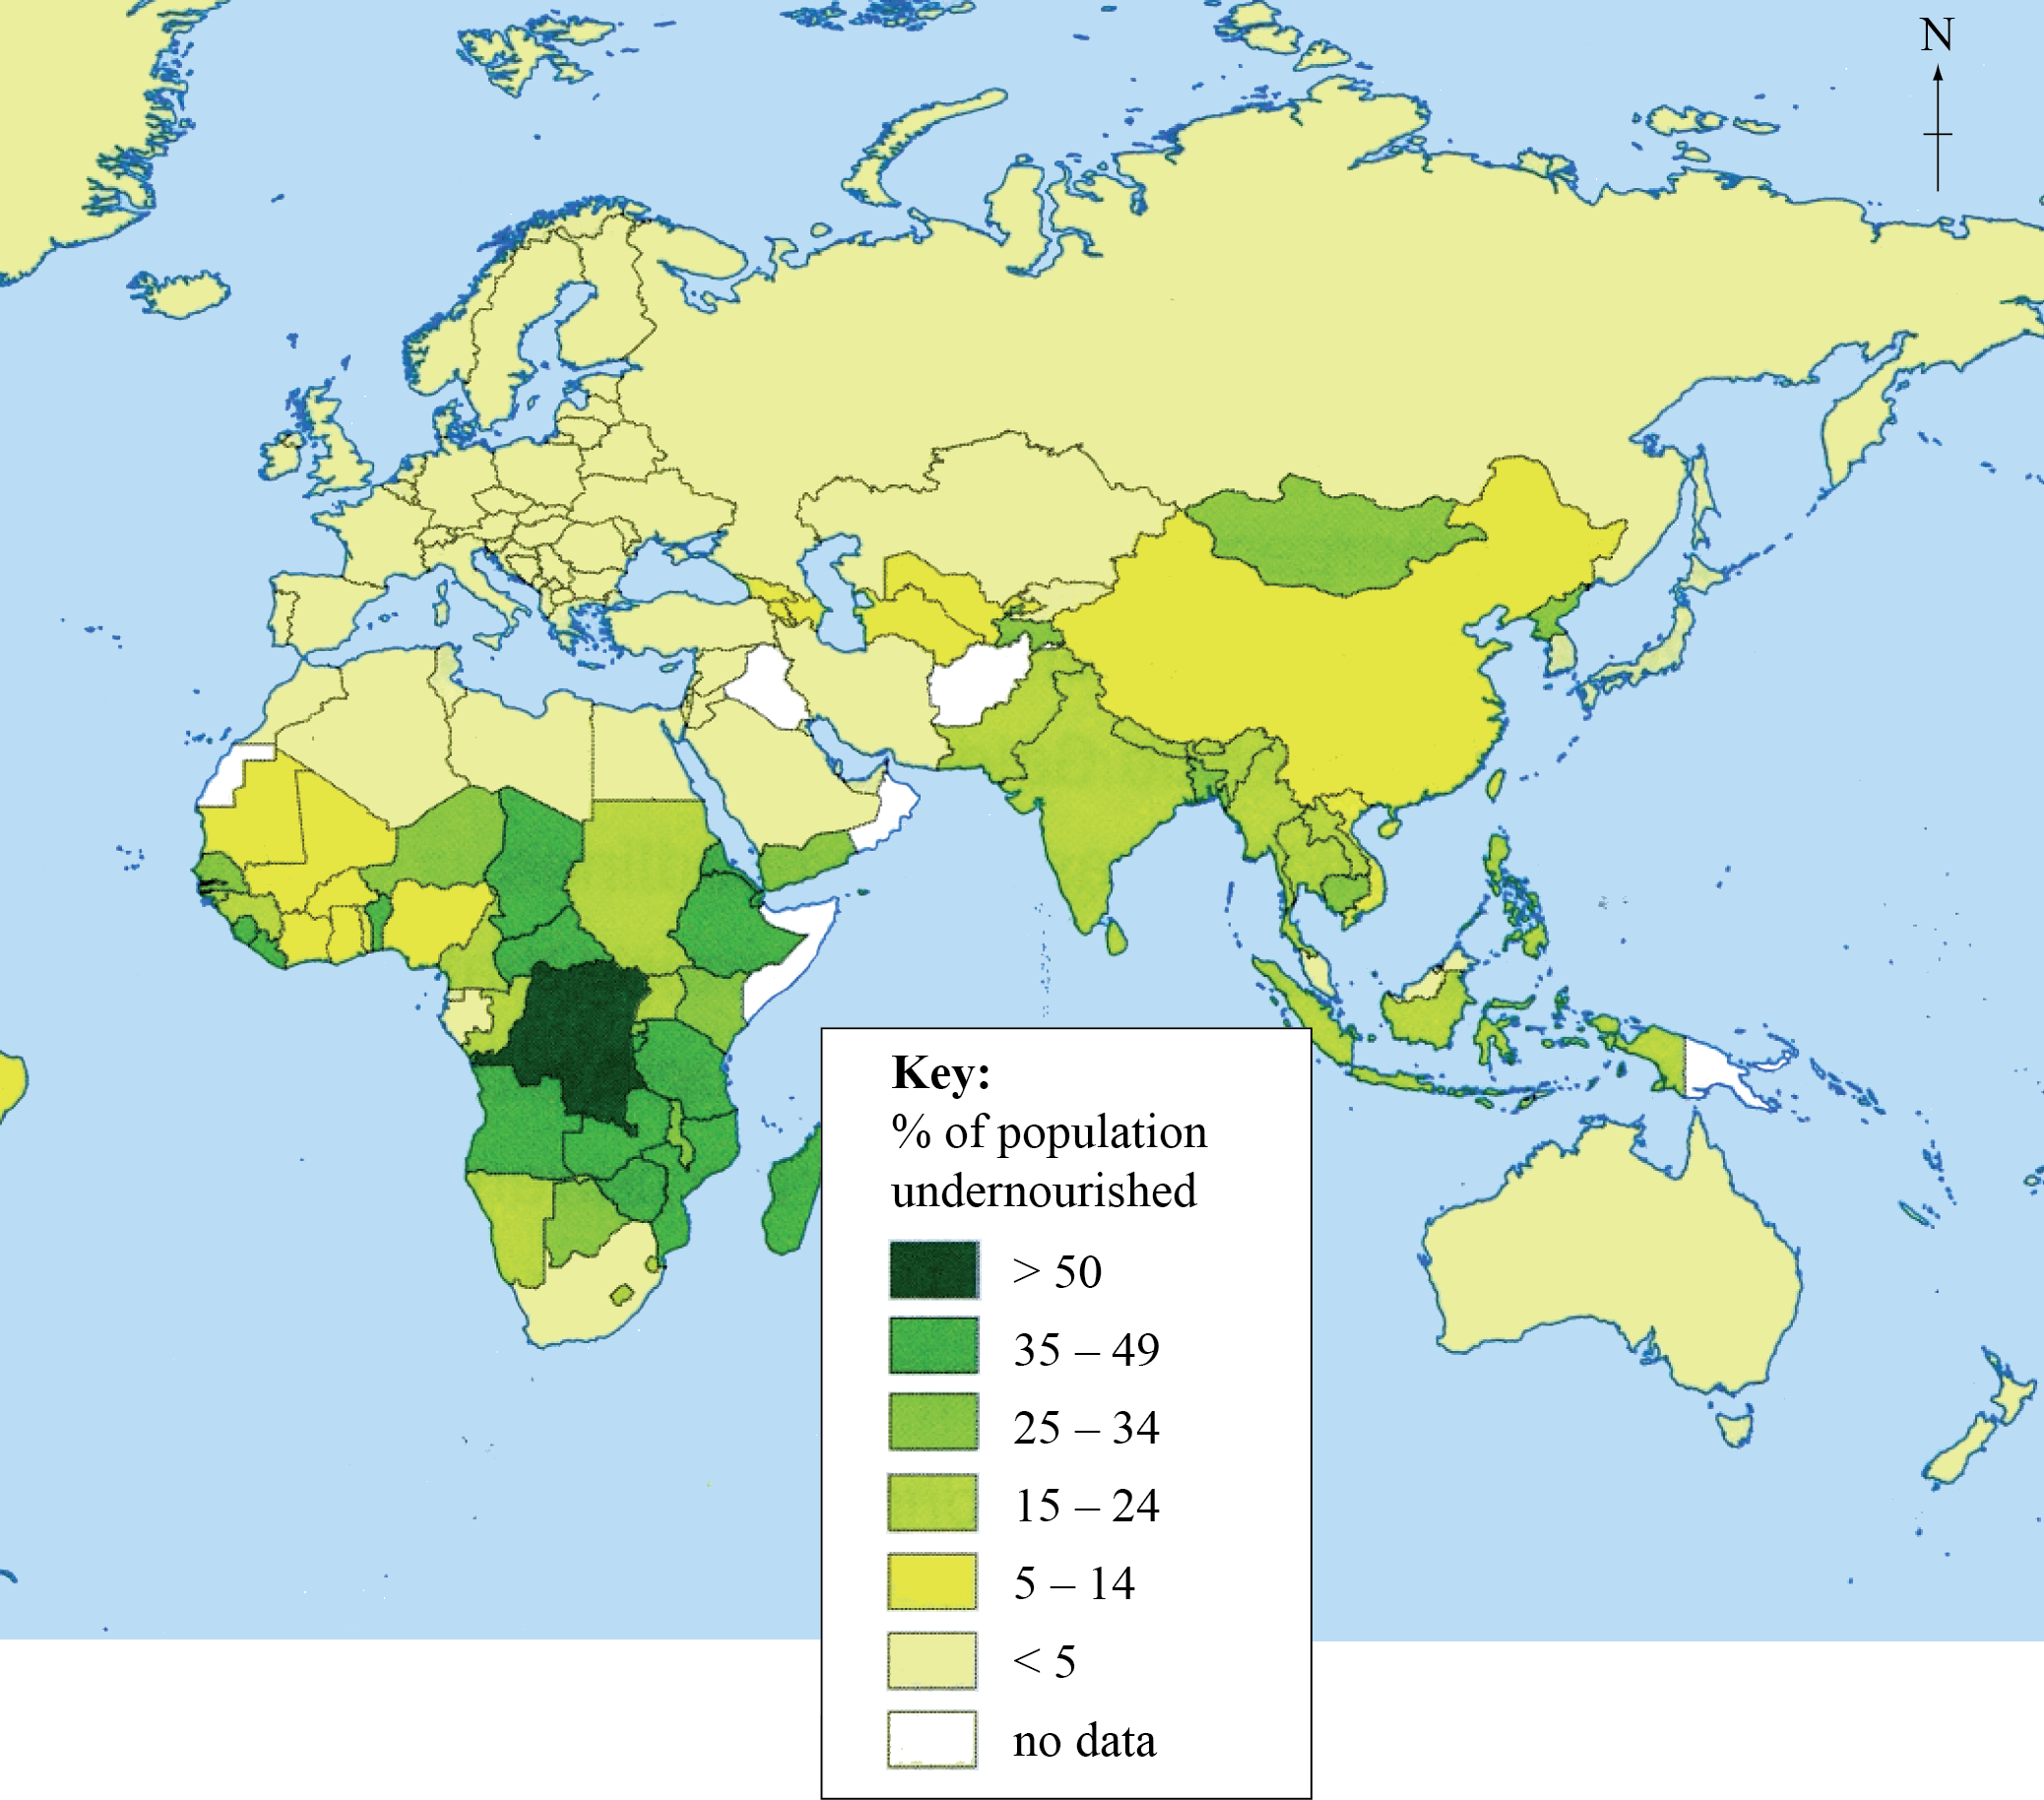
The map shows part of the global pattern of low calorie intake (undernourishment).

[Source: E M Young, (2010), Deadly Diets: Geographical Reflections on the Global Food System. Geography, volume 95, issue 2, pages 60–69]
Describe the difference between malnutrition and low calorie intake.
Describe the pattern of undernourishment shown on the map.
Explain two economic causes of food deficiency.
With reference to any one vector-borne, water-borne or sexually transmitted disease, compare its geographic impacts at the local and international scales.
Markscheme
Malnutrition means an inadequate/unbalanced supply of energy, vitamins or other food-based nutrients (malnutrition includes both under- and over-nutrition) [1 mark]. Low calorie intake is a subset of malnutrition and is therefore a condition where people receive insufficient calories to maintain a healthy weight [1 mark].
The highest rate/prevalence of undernourishment (over 50%) is in central Africa [1 mark], especially the DRC [1 mark]. South/south-east Asia is generally lower than Africa but higher than Europe/Russia/Australia [1 mark].
Other important features that may be awarded [1 mark] include: low levels in north Africa and south Africa; lower levels in the Middle East; higher value (may describe as anomaly) in Mongolia/central Asia.
For the award of full marks some quantification is necessary.
N.B. country names are not essential for the award of the full [4 marks].
The economic causes of food deficiency include: price increases in staple food items (regardless of why or how they arise, whether from local changes or changes in other regions or countries); transition from food-based agriculture to non-food commercial or export agriculture; inadequate transport infrastructure for food (including food aid) to be supplied and/or distributed efficiently; failure to invest in irrigation projects meaning that the area is unable to cope in times of low rainfall or drought. Credit other valid causes.
Award [1 mark] for each valid cause, with a further [1 mark] for its development.
The response will depend on the disease selected. The relative importance of local and international scales will differ depending on the disease selected.
Some diseases, such as river blindness, have a serious local impact (and some national impacts) but relatively few or no international impacts). Other diseases, such as SARS and A-H1N1 influenza have the potential to impact all scales. Knowledge of the biology/pathology of the chosen disease is not expected, except in so far as it determines specific impacts of geographic importance.
Responses accessing band D and above should refer to both scales, though the amount of depth for each scale need not be equal. Credit should only be awarded for a single disease. In the case of responses which consider more than one disease, the disease scoring most marks should be credited.
Responses reaching bands E/F are expected to show accurate knowledge of a disease, and to consider a range of impacts before concluding whether or not the impacts are similar at the two scales.
Marks should be allocated according to the markbands.
Examiners report
Most responses correct.
A few were very generalized, for example, Africa, or used descriptive terms, for example, top, left.
Many candidates found it difficult to remain focused on economic causes – political, environmental and physical causes were included, demonstrating only a very limited understanding of food deficiency.
A very open-ended question with a number of diseases that could be chosen. The most common were malaria and AIDS/HIV. Many just discussed the disease and its causes and spread rather than examining its impacts. Although there were some good local scale impacts most had difficulty relating it to the international scale and therefore comparing it.

