| Date | May 2012 | Marks available | 2+2+2 | Reference code | 12M.2.bp.14 |
| Level | SL and HL | Paper | 2 | Time zone | |
| Command term | Explain | Question number | 14 | Adapted from | N/A |
Question
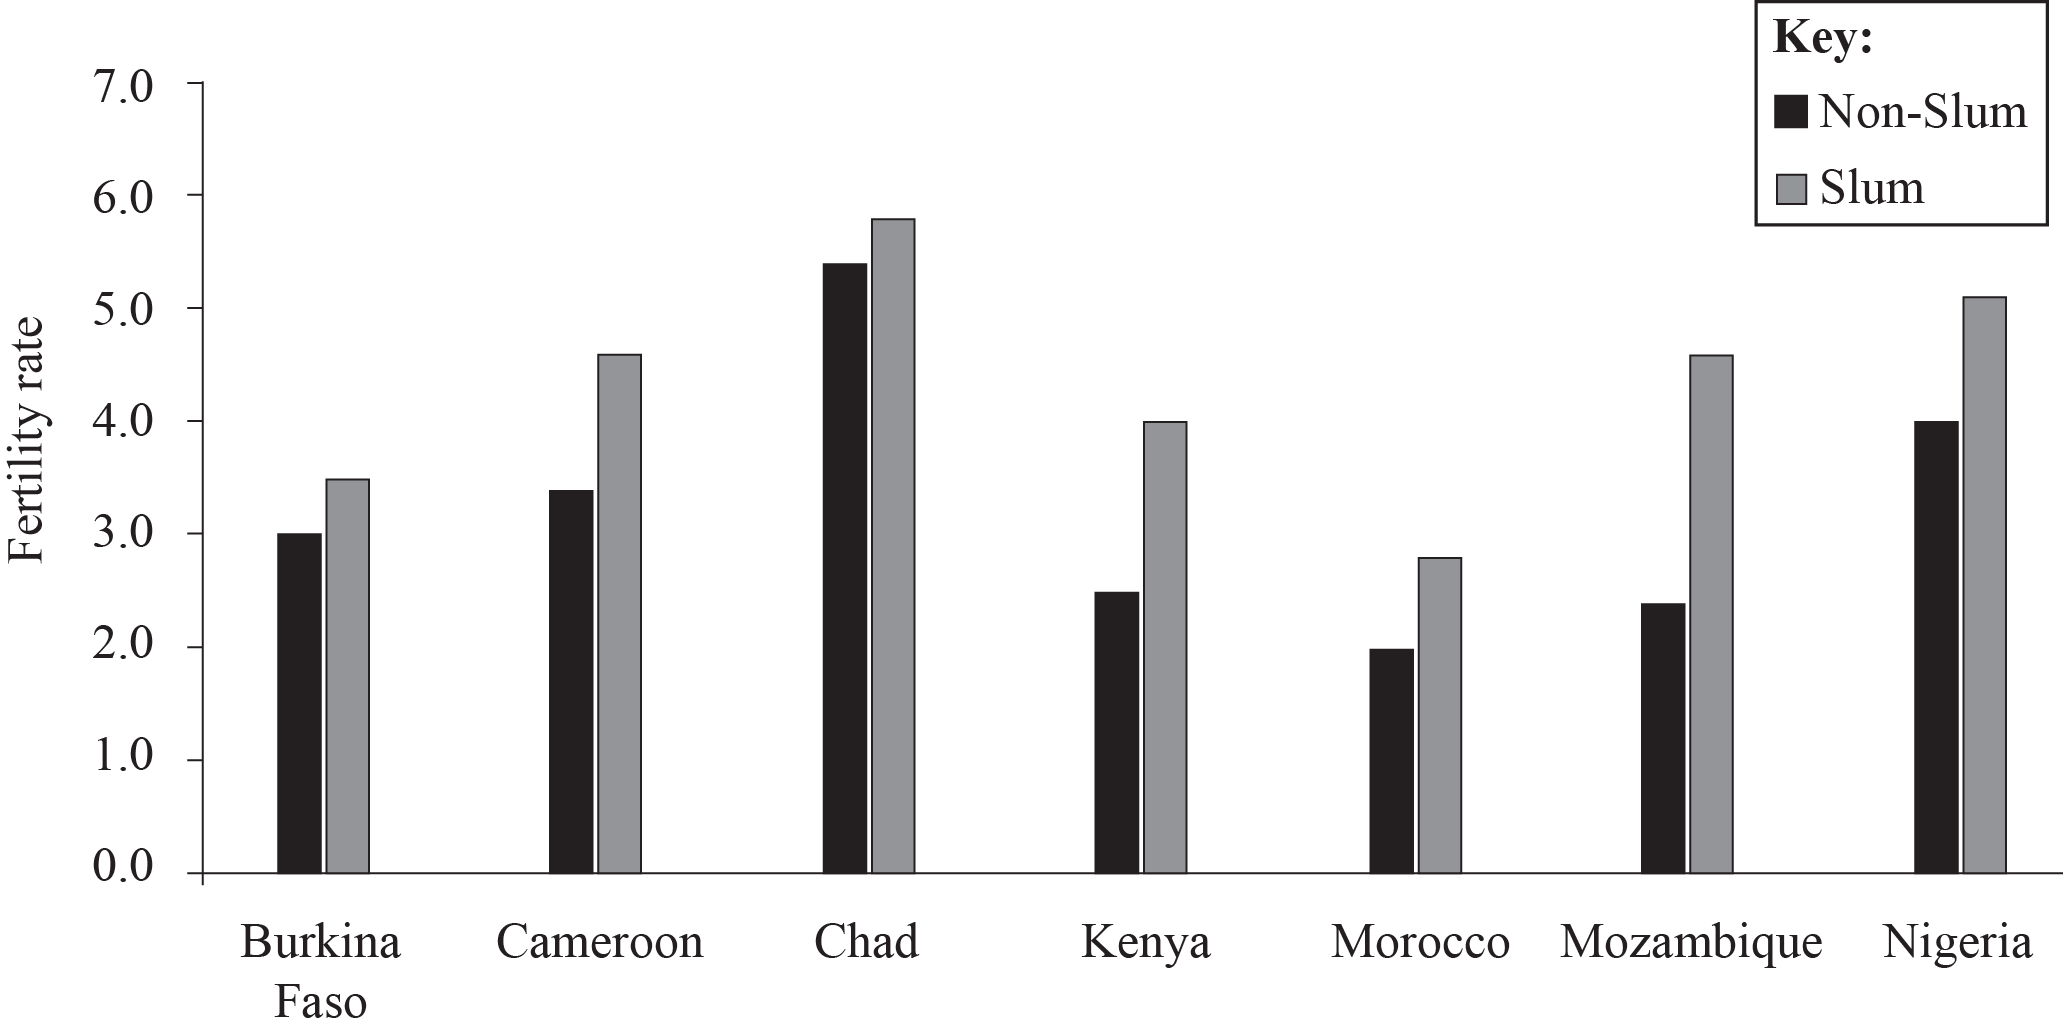
The graph shows fertility rates in 2006 for slum and non-slum areas in various African countries. Fertility is an indicator of poverty.

[Source: adapted from State of World Population (2007), UNFPA]
Describe the differences in fertility shown on the graph.
Explain three other social differences (other than fertility rates) between slum and non-slum populations.
Evaluate the effectiveness of one or more strategies to control rapid city growth resulting from in-migration.
Markscheme
Slum fertility rates are higher than non-slum fertility rates in all cases [1 mark]. Morocco has the lowest fertility rates in all categories [1 mark], while Chad has the highest [1 mark].
A maximum of 3 marks should be awarded for description with the remaining 1 mark reserved for quantification.
Possibilities include health, education, migrant status, ethnicity, age, language, religion, caste. Award 1 mark for each valid reason with an additional 1 mark for further explanation.
Answers will depend upon the strategies chosen and their location(s). Examples may include: vertical development, rural development schemes, development of satellite urban areas, government legislative controls, population control etc.
Good answers may recognize/quantify the scale of current urbanization trends and may conclude that no strategy (for example, new towns) can fully accommodate continuing in-migration.
Answers which do not have any evaluation should not proceed beyond band D.
Answers that do not make effective reference to examples or case studies are unlikely to go beyond band D.
Marks should be allocated according to the markbands.
Examiners report
This was well answered by almost all candidates.
This was well answered by almost all candidates, excepting for the occasional lapse into factors that were not social.
This elicited a wide range of quality in responses. The weakest focused on national-level population control measures of limited or no relevance. Many of the strategies suggested, and the details of examples of cities where they had been tried, were unconvincing and failed to incorporate an evaluation.

