| Date | November 2011 | Marks available | 3 | Reference code | 11N.2.bp.13 |
| Level | SL and HL | Paper | 2 | Time zone | |
| Command term | Describe | Question number | 13 | Adapted from | N/A |
Question
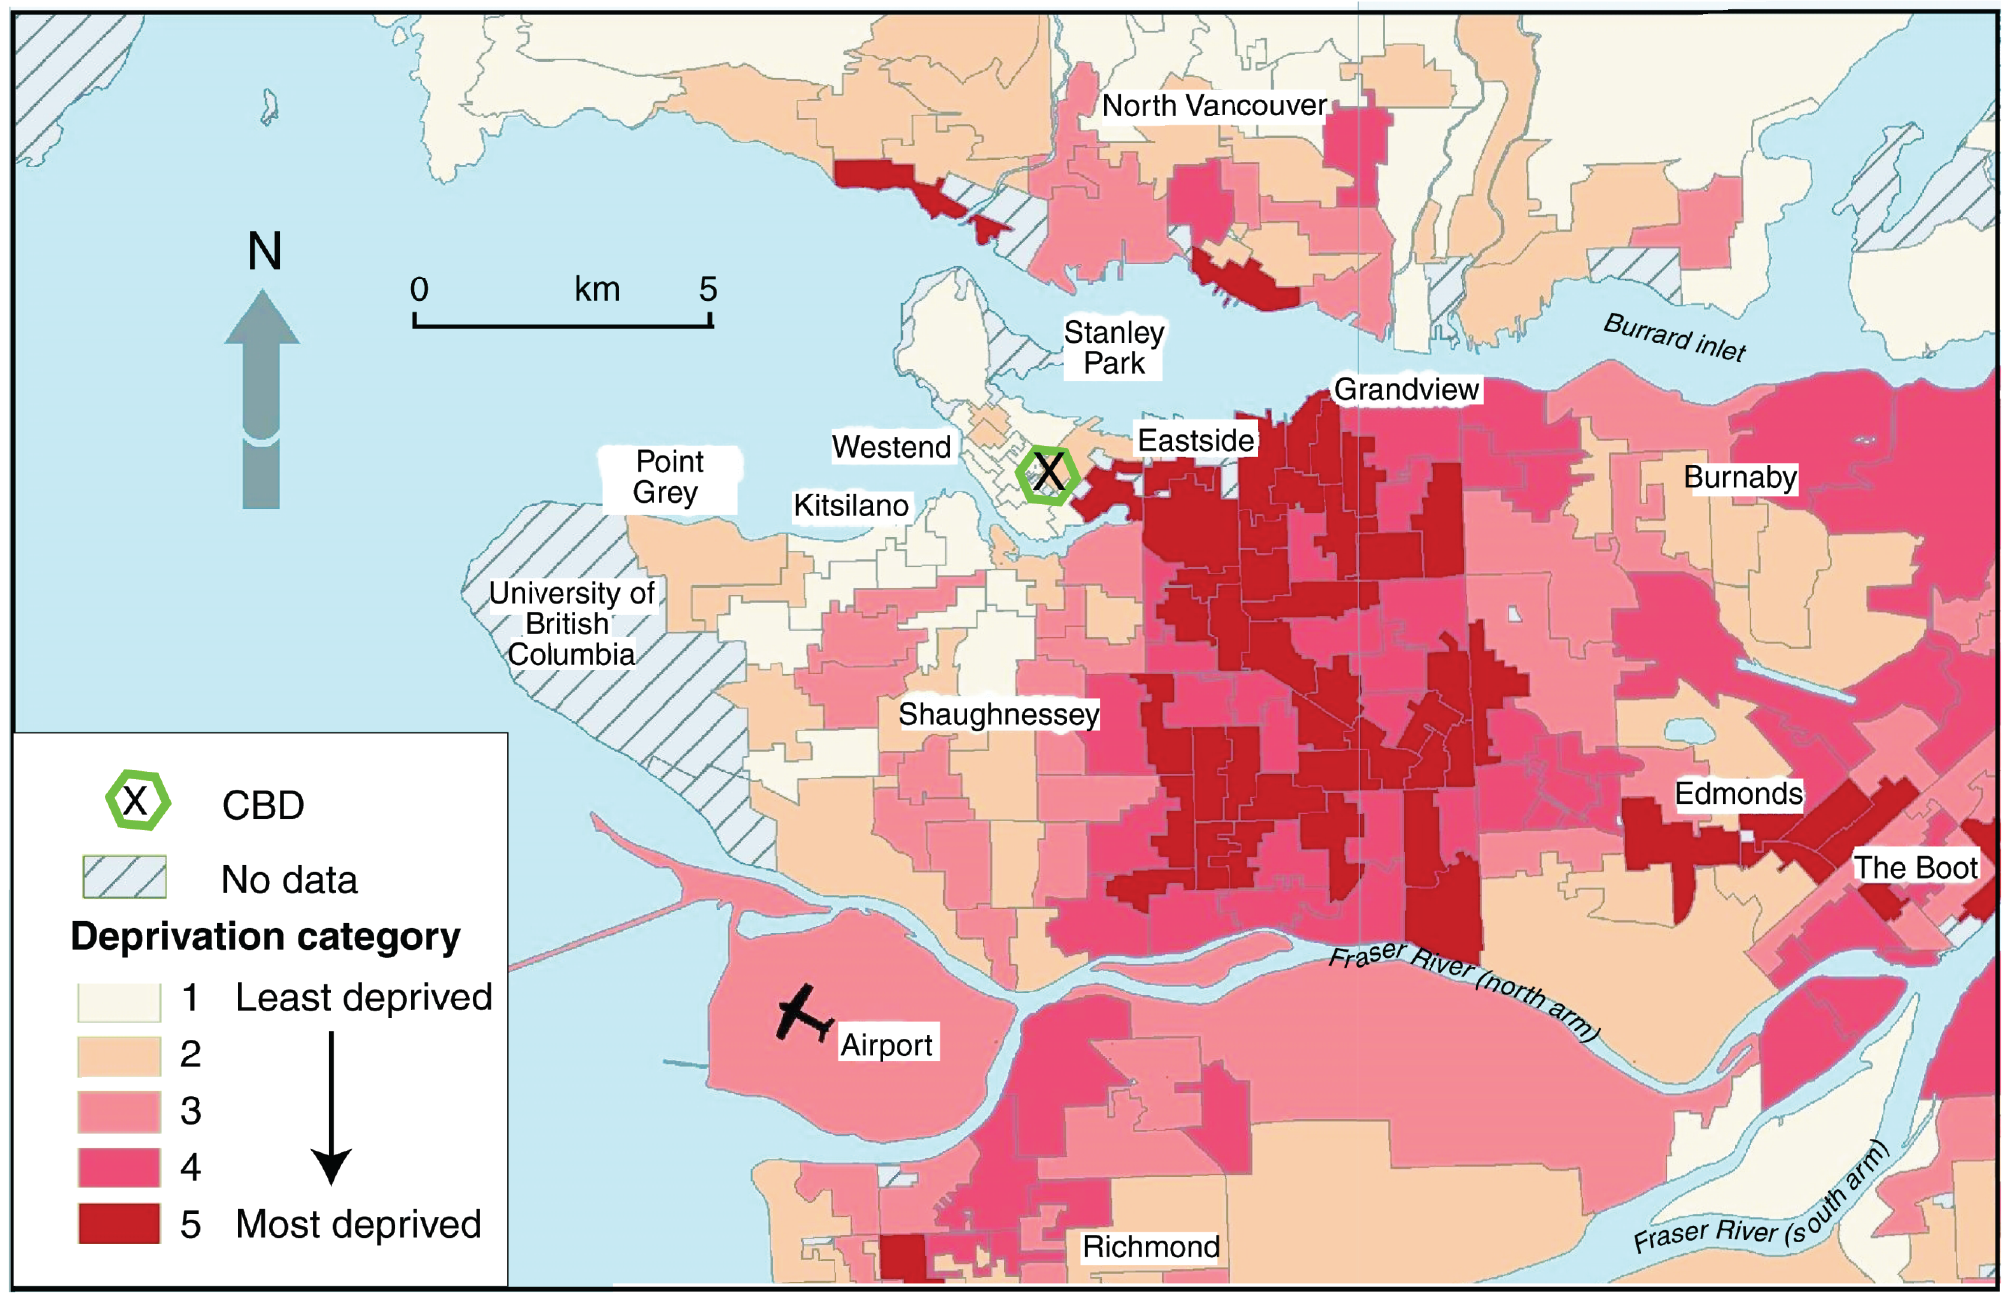
The map shows the pattern of deprivation for Vancouver, one of Canada’s wealthiest cities.

[Source: Springer and the Journal of Urban Health, volume 84, 2007, 591-603, ‘Deprivation indices, population health and geography: an evaluation of the spatial effectiveness of indices at multiple scales’, Nadine Schuurman, Nathaniel Bell, James R Dunn and Lisa Oliver, no 4, with kind permission from Springer Science+Business Media B.V..]
Describe the pattern of deprivation shown on the map.
Explain how and why the pattern of deprivation might differ for a city in a low income country.
Evaluate one or more sustainable strategies designed to improve life in urban areas.
Markscheme
Points made for 1 mark each could include:
The two largest areas of “most deprived” (category 5) is south of Eastside and Grandview, stretching as far as the north arm of the Fraser River. The northern part of this area (Eastside) borders the CBD. The largest areas of “least deprived” (category 1) are Westend, Kitsilano and Shaughnessey. Parts of North Vancouver, Edmonds and Richmond also stand out as having relatively little deprivation (category 2). In general, despite exceptions, areas towards the edge of the city tend to be less deprived than areas in the centre of the map.
Award 1 mark for each valid point. Some place names must be included for the awarding of the full 3 marks.
Responses are expected to compare patterns of deprivation found in a city that is less developed than Vancouver, Canada. Accept any reasonable interpretation, including NICs.
Responses should clearly include an explanation of how the pattern would differ for a maximum of 2 marks. The most likely responses include:
- Least deprived areas are more likely to be found in central areas, and more deprived areas nearer the urban fringe (reversal) [1 mark].
- Transport lines could lead to the formation of linear belts of deprivation [1 mark].
- It may be less easy to identify a pattern – more likely to respond to local factors than comply to a pattern, for example, slums also in/around CBD [1 mark].
Candidates are expected to offer at least two developed explanations for the differences identified, up to a maximum of 3 marks for any one idea, although a wider range of shorter explanations is also acceptable.
Reasons why the pattern may differ include:
- Centripetal forces attract population to the city in contrast to the centrifugal forces in most cities in rich countries – levels of deprivation are therefore likely to be higher.
- Land available for housing development by growing population is found at urban fringe (where claims to ownership may not have been formally expressed).
- Poor transport infrastructure means land close to the commercial centre is valued highly by high-income groups meaning that less deprivation is found there.
- Lack of planning and governance leads to a more informal and pragmatic approach to development, making it harder to identify overall patterns.
An annotated sketch map may substitute for text.
The sustainable strategy chosen is likely to be one that addresses either a social issue (housing quality), environmental issue (air, water, land resources) or overall city growth (and in-migration) – in ways that seek to maintain and improve the quality of life for current and future urban dwellers.
Responses should go beyond mere description of a management strategy. Answers should provide effective evaluation, addressing both positive and negative aspects of the strategy, the problems encountered and some conclusion on the success of the scheme. Answers that do all of this will access bands E/F.
Answers that evaluate an urban management strategy that is not explicitly sustainable (does not mention future generations or ecological footprints etc.) should be limited to band D.
Marks should be allocated according to the markbands.
Examiners report
This was usually well answered though the most common error was not to refer to places named on the map.
This was usually disappointing, with few able to concentrate on "pattern".
Most answers simply explained the existence of squatter settlements without referring to areas of high and low deprivation and their relative locations in a city in a low-income country. There were some good answers, though at both levels, many were overly descriptive and had only very limited evaluation. Frequently, relevant strategies were detailed without saying how they related to sustainability.

