| Date | November 2011 | Marks available | 1+1 | Reference code | 11N.2.bp.12 |
| Level | SL and HL | Paper | 2 | Time zone | |
| Command term | State and State | Question number | 12 | Adapted from | N/A |
Question
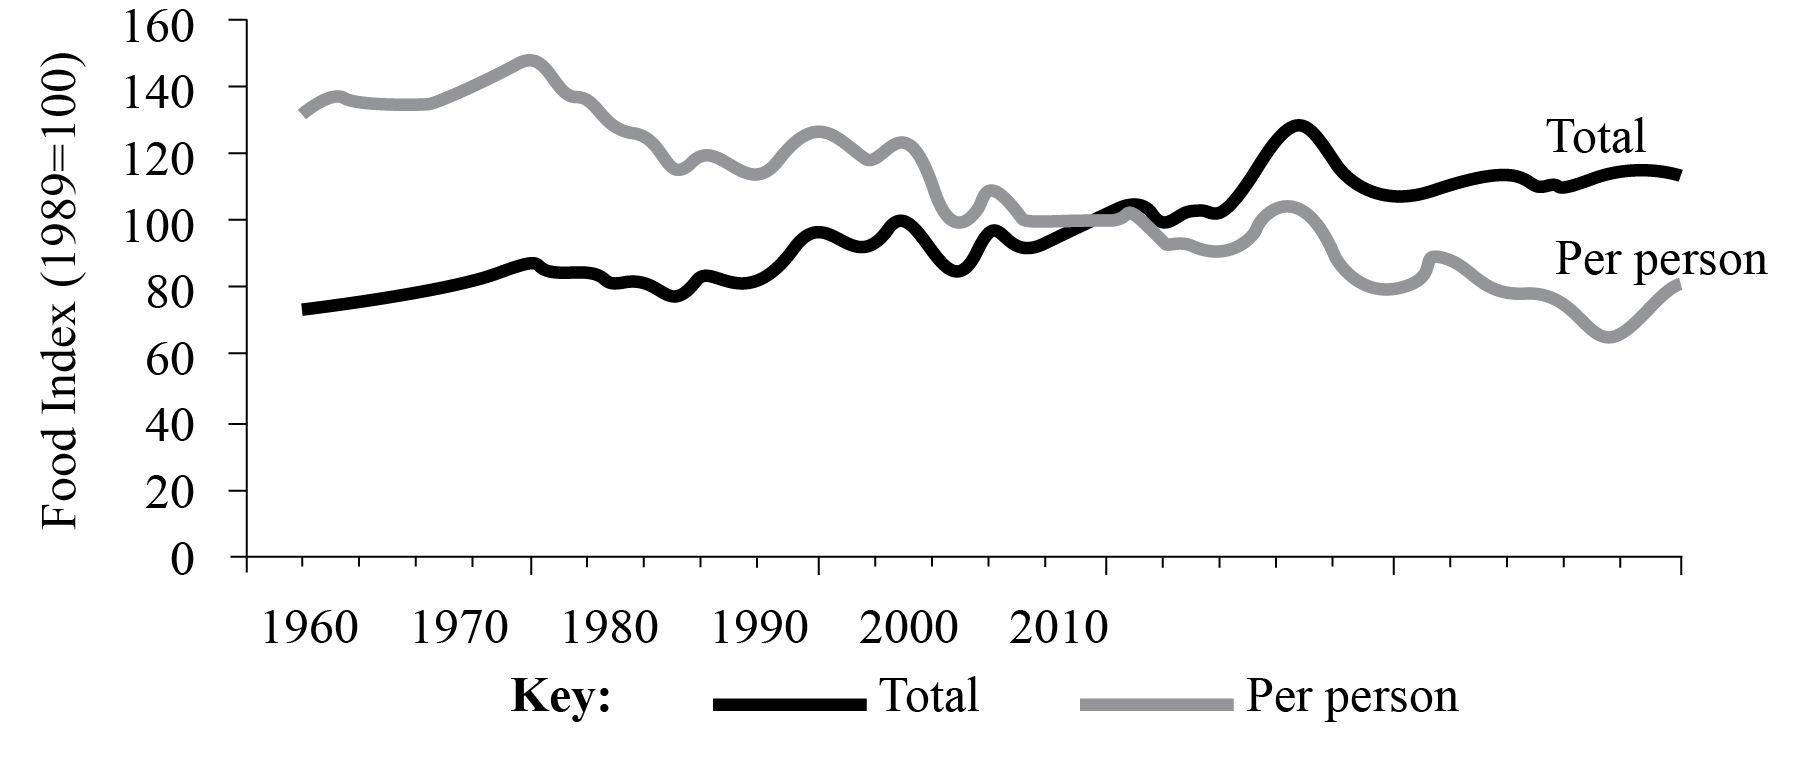
The graph shows the total food production and food production per person in Country A, 1962–2010.

[Source: Geofile (Nelson Thornes, 2005)]
(i) State the year when the index of total food production was greatest.
(ii) State the value of the food index per person in 1970.
Describe the trend in total food production shown on the graph.
Suggest reasons for the trends in total food production and in food production per person from 1962 to 2010.
Examine the geographic connections between food availability and health.
Markscheme
(i) Accept either 1996 or 1997 [1 mark].
(ii) Accept any answer in range 140–150 inclusive [1 mark].
Total food production is rising [1 mark] with another 1 mark for quantification or recognition of any anomaly.
Award 1 mark for a brief description of each valid reason, and a further 1 mark for developing it by means of example, explanation or detail. Both total food production and food production per person must be covered, though not necessarily in equal depth for the awarding of the full 6 marks.
Possible reasons for the increase in total food production include: a greater area of land under cultivation due to land improvement (drainage, irrigation) or land clearance; higher crop yields due to better agricultural techniques; the application of fertilizers, biotechnology or improved seeds; higher productivity due to effective pest control measures or application of improved technology.
The main reason for the decline in food production per person is an increase in population, which in turn may be due to either natural increase or in-migration.
Some answers may refer to the anomalies. This is also acceptable, but reasons for anomalies such as natural hazards, wars and plagues, should not receive more than 2 marks out of the total 6 marks available.
There are many links between food availability and health. Health is generally better in areas of higher food availability: vitamin and calorie-deficiency diseases would be less likely; immune systems would be more robust; recovery from disease faster. On the other hand, too much food being available can lead to other health issues related to being overweight or obese. Greater food availability is often linked to economic development. Assuming this link is made explicit, responses may legitimately include reference to related aspects such as improved medical care, vaccinations and preventative measures.
Some responses may subdivide food availability into different categories, such as economic food availability and physical food availability. However, this is not necessary for the awarding of full marks.
To reach bands E and F, responses should look at health issues in relation to shortage and excess food availability.
Marks should be allocated according to the markbands.
Examiners report
This was generally well done.
This was generally well done.
Answers were better on "total food production" than on "food production per person"; some candidates wrote about "food availability" which is a different concept, or uneven distribution, which was invalid. Some answers did not appreciate that the graph used index values and thought they could compare the two lines in a quantitative way.
There were some interesting answers, which were generally along the right lines. These usually examined the effects of lack of food leading to undernourishment or the availability of excess food leading to dietary problems and obesity. A surprising number of answers showed a lack of awareness of the diseases caused by poor diet related to food availability.

