| Date | November 2013 | Marks available | 4 | Reference code | 13N.2.hl.12 |
| Level | HL only | Paper | 2 | Time zone | |
| Command term | Explain | Question number | 12 | Adapted from | N/A |
Question
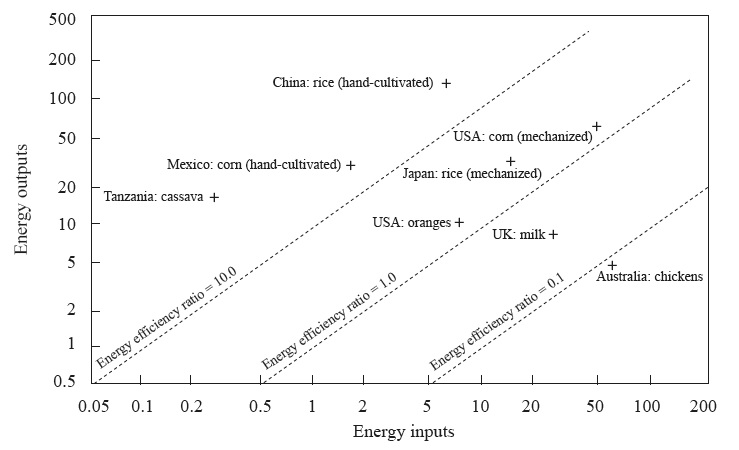
The graph shows the energy inputs and outputs for a number of different farming systems (the units are gigajoules per hectare per year).

[Source: Reprinted from Food Policy, volume 1, Gerald Leach, Energy and food production, 1975, with permission from Elsevier]
(i) Identify the farming system shown on the graph which has the highest energy output.
(ii) Identify the farming system which has the highest energy efficiency ratio.
Referring to the graph, suggest how mechanization contributes to the different energy flows (inputs and outputs) for rice farming systems shown in China and Japan.
Explain two changes in agriculture, other than mechanization, that have helped to boost food production in some areas.
“Free trade is more important than food aid in helping to solve (alleviate) food shortages.” Discuss this statement.
Markscheme
(i) China: rice (hand-cultivated) [1 mark].
(ii) Tanzania: cassava [1 mark].
Japan’s inputs are about double those of China but China’s outputs are more than double [1 mark]. Award [1 mark] for additional quantification, or identification of China’s EER as much higher than Japan’s.
Up to [3 marks] for reasons such as:
Mechanization involves high fossil fuel usage [1 mark] but does not necessarily increase energy output. Output level also depends on the intensity of cultivation (tiny farms may have very high yields) [1 mark]. Mechanization may be responsible for only some of the additional energy inputs, so the higher outputs may be associated with fertilizer or other agro-chemical use [1 mark].
Possibilities include irrigation, HYV crops (Green Revolution) bringing new land into use, better pest controls, (organic) fertilizers, glass-houses, poly-tunnels, subsidies and introducing GM crops. Accept other valid suggestions. For each change, award [1 mark] for identifying or describing the change and [1 mark] for a development/exemplification/quantification that helps establish a clear link to an increase in food production in an area.
There are many possible approaches to this question.
Responses are expected to show a clear understanding of the differences between food aid and free trade, and also indicate that there are many different kinds of food shortages, such as short-term/seasonal/long-term/chronic (temporal) and local/national/regional (spatial). Strong responses are likely to show that the relative importance of food aid, as opposed to free trade, will depend on the temporal and spatial extent of the food shortage in question.
The very best answers may challenge the role of free trade and/or food aid in alleviating food shortages and offer examples where the reverse is true.
Responses that fail to use any examples or fail to clearly distinguish between food aid and free trade are unlikely to progress beyond band D.
Responses that discuss most aspects of the question with examples, and attempt some conclusion are likely to access band E.
At band F expect a well balanced attempt at evaluation.
Marks should be allocated according to the markbands.

