| Date | May 2012 | Marks available | 2+2 | Reference code | 12M.1.bp.1 |
| Level | SL and HL | Paper | 1 | Time zone | |
| Command term | Explain | Question number | 1 | Adapted from | N/A |
Question
The graph below shows the relationship between GDP per capita and life expectancy at birth for a number of countries in 2010.
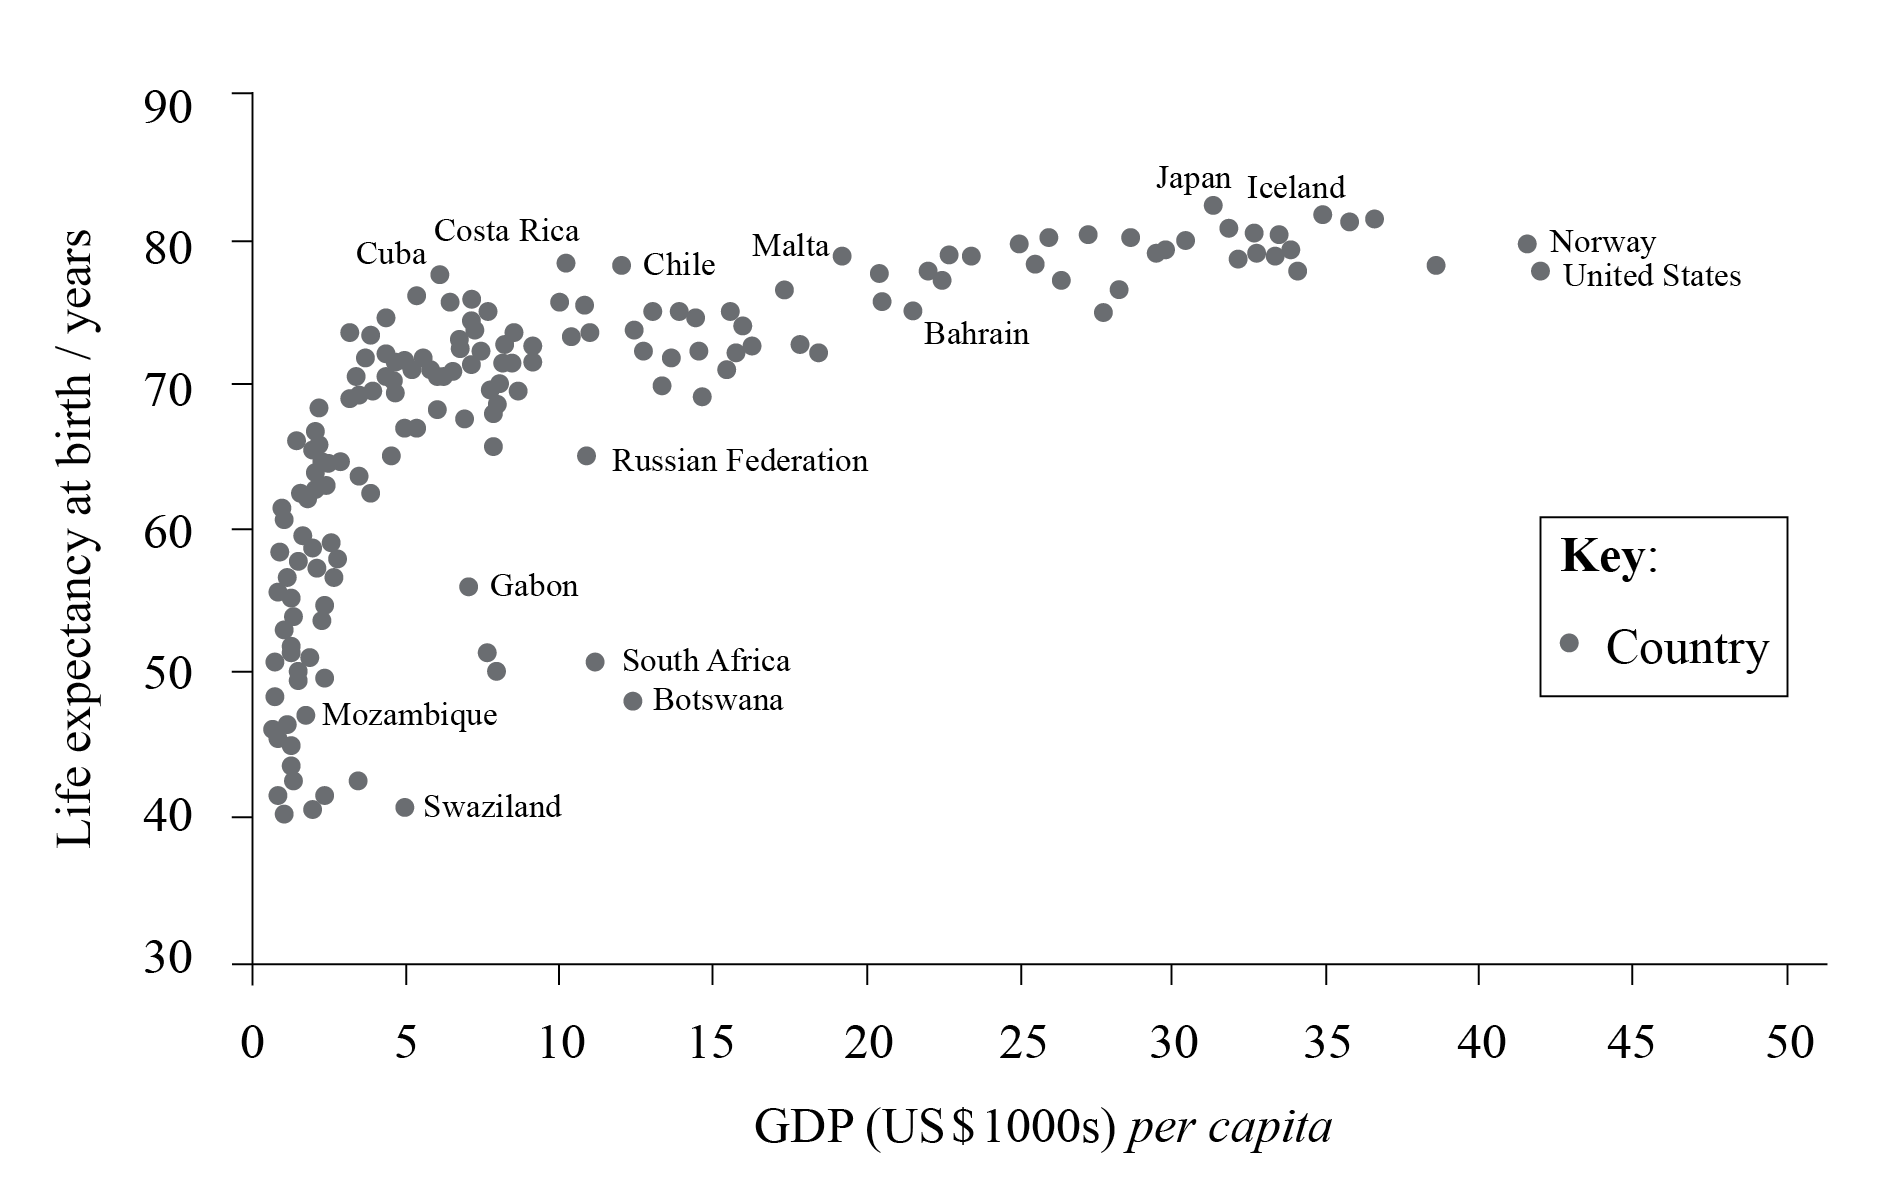
[Reproduced from Wilinson R.G. and Pickett K.E., The Spirit Level: Why more equal societies always do better.]
(a) Describe the relationship shown on the graph.
(b) Suggest two possible reasons for the relationship described in (a).
Explain two economic effects of a youthful population structure.
Markscheme
(a) There is a positive relationship/life expectancy at birth increases as GDP per capita increases [1 mark], but it is non-linear/levels off [1 mark]. Award 1 mark for identification of an anomaly. Reserve 1 mark for quantification.
(b) Award 1 mark for identifying a valid reason and 1 mark for further development and/or exemplification. For example, higher GDP per capita implies a higher standard of living – this will impact upon diet/hygiene/sanitation/water supply/access to health care etc. which will impact upon longevity [1+1 marks].
Award 1+1 marks for each valid economic effect, provided that it is developed by means of explanation or detail. For example, the demographic dividend – a youthful population if combined with a falling fertility rate [1 mark] can result in a future bulge in the economically active group/labour force [1 mark].
Other possible economic effects that could be explained:
- potential increased unemployment in the future if jobs are not created
- burden on taxpayers – increases due to increased state spending on child-related services such as schools.
Examiners report
a) This question was misread by a large number of candidates who described the temporal changes as opposed to the situation in 1997. It was still possible to grant some marks though if they described and quantified the situation in 1997. A significant number of candidates scored full marks for this question.
b) This question was on the whole well answered with candidates opting for breadth or depth. Reasons given were quite varied ranging from the role of the MDGs, cultural diffusion, the impact of media networks, NGOs working on gender issues, governments introducing quotas etc. Sometimes the reasons were not linked back to the question though, that is, empowerment in politics, which prevented full marks from being awarded.
Some excellent and detailed responses here with the popular examples being Singapore, France, Sweden, Spain and Japan. However, some candidates failed to analyse (they just described the policy) and therefore did not get full marks. Some candidates relied on policies from the 1950s and 1960s; although they still accessed the marks it would be better if they studied more up-to-date case studies. A minority of candidates used anti-natalist policies, which scored no marks.