| Date | November 2013 | Marks available | 10 | Reference code | 13N.2.hl.13 |
| Level | HL only | Paper | 2 | Time zone | |
| Command term | Examine | Question number | 13 | Adapted from | N/A |
Question
The diagram shows the ways in which urban trees help to reduce environmental and social stress for the inhabitants of a major city. The numbers are the estimated annual value of the benefits, in US dollars (US$).
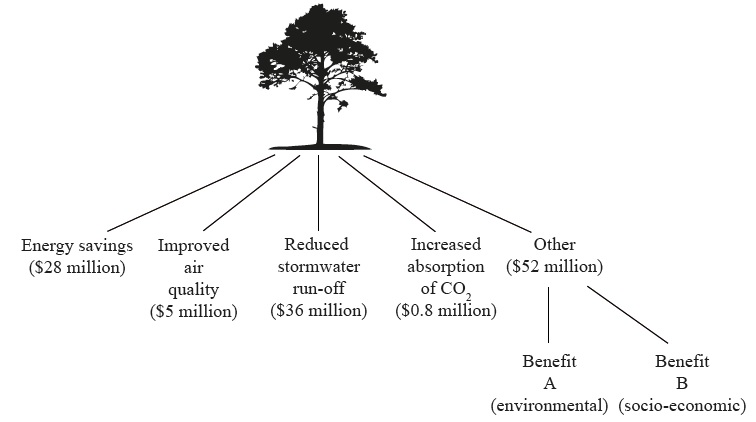
[Source: adapted from “Tree Count Results”; New York City Department of Parks & Recreation, 2006, http://www.nycgovparks.org]
Identify what Benefit A (environmental) and Benefit B (socio-economic) might be.
(i) Define the term urban ecological footprint.
(ii) Explain how one of the benefits named on the diagram (excluding “Other”) would reduce the city’s ecological footprint.
Explain how human activity in cities may result in an urban heat island effect.
Examine the reasons why economic activities (such as retailing, service and/or manufacturing industries) sometimes change location within an urban area.
Markscheme
A could be: improved wildlife/bird habitat; microclimate modification; increased biodiversity; reduced noise pollution.
B could be: recreational space; increased land/property values; increased community pride; less crime.
Accept other valid suggestions (for example, aesthetics, feelings, improved health, firewood/fuel).
(i) The theoretical measurement of the amount of land and water [1 mark] a population requires to produce the resources it consumes and to absorb its waste [1 mark] (under prevailing technology).
(ii) For example, energy savings: award [1 mark] for explaining how trees might lead to energy savings (due to reduced need for air conditioning in summer) and [1 mark] for relating this to a reduction in the resources/land area required to meet the lower energy needs.
Urban temperatures are higher than surrounding areas [1 mark]. Further development of this definition, or applied use of an example, could merit another [1 mark], for example, mentions daily or annual variations in strength or has vertical and lateral components. Award up to [3 marks] for explaining how human activities (domestic cooling/heating, construction, transportation, industries, changes to nature of surfaces/albedo) help cause it.
Wide variety of possible approaches, depending on examples chosen. The causes of retail movements include shifts in population (for example, suburbanization), the changes in average age within an urban area (life cycle), location of employment opportunities, availability of land for “big-box” stores/superstores and out-of-town shopping centres, range of costs driving retailers out of CBD (including online competition), transport links, regeneration projects, gentrification, etc. Manufacturing movements may be influenced by land-use zoning, environmental considerations, proximity to labour, transport links and markets, etc.
At band D, candidates should be able to describe the changing location of economic activities in a named urban area.
At band E, locational changes should be explained for more than one type of activity and a range of reasons given.
At band F there should be accurate and detailed knowledge and understanding, with well developed case studies.
Marks should be allocated according to the markbands.