| Date | November 2020 | Marks available | 5 | Reference code | 20N.1.SL.TZ0.S_8 |
| Level | Standard Level | Paper | Paper 1 | Time zone | Time zone 0 |
| Command term | Calculate | Question number | S_8 | Adapted from | N/A |
Question
Each athlete on a running team recorded the distance ( miles) they ran in minutes.
The median distance is miles and the interquartile range is miles.
This information is shown in the following box-and-whisker plot.
The distance in miles, , can be converted to the distance in kilometres, , using the formula .
The variance of the distances run by the athletes is .
The standard deviation of the distances is miles.
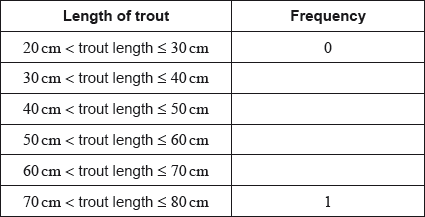
A total of athletes from different teams compete in a race. The times the athletes took to run the race are shown in the following cumulative frequency graph.
There were athletes who took between and minutes to complete the race.
Find the value of .
Write down the value of the median distance in kilometres (km).
Find the value of .
Find .
The first athletes that completed the race won a prize.
Given that an athlete took between and minutes to complete the race, calculate the probability that they won a prize.
Markscheme
* This question is from an exam for a previous syllabus, and may contain minor differences in marking or structure.
valid approach (M1)
eg
A1 N2
[2 marks]
(km) A1 N1
[1 mark]
METHOD 1 (standard deviation first)
valid approach (M1)
eg
standard deviation (km) (A1)
valid approach to convert their standard deviation (M1)
eg
(miles) A1 N3
Note: If no working shown, award M1A1M0A0 for the value .
If working shown, and candidate’s final answer is , award M1A1M0A0.
METHOD 2 (variance first)
valid approach to convert variance (M1)
eg
variance (A1)
valid approach (M1)
eg
(miles) A1 N3
[4 marks]
correct frequency for minutes (A1)
eg
adding their frequency (do not accept ) (M1)
eg athletes
(minutes) A1 N3
[3 marks]
(minutes) (A1)
correct working (A1)
eg athletes between and minutes,
evidence of conditional probability or reduced sample space (M1)
eg
correct working (A1)
eg
A1 N5
Note: If no other working is shown, award A0A0M1A0A0 for answer of .
Award N0 for answer of with no other working shown.
[5 marks]


