| Date | November 2016 | Marks available | 2 | Reference code | 16N.2.SL.TZ0.S_8 |
| Level | Standard Level | Paper | Paper 2 | Time zone | Time zone 0 |
| Command term | Write down | Question number | S_8 | Adapted from | N/A |
Question
Ten students were surveyed about the number of hours, , they spent browsing the Internet during week 1 of the school year. The results of the survey are given below.
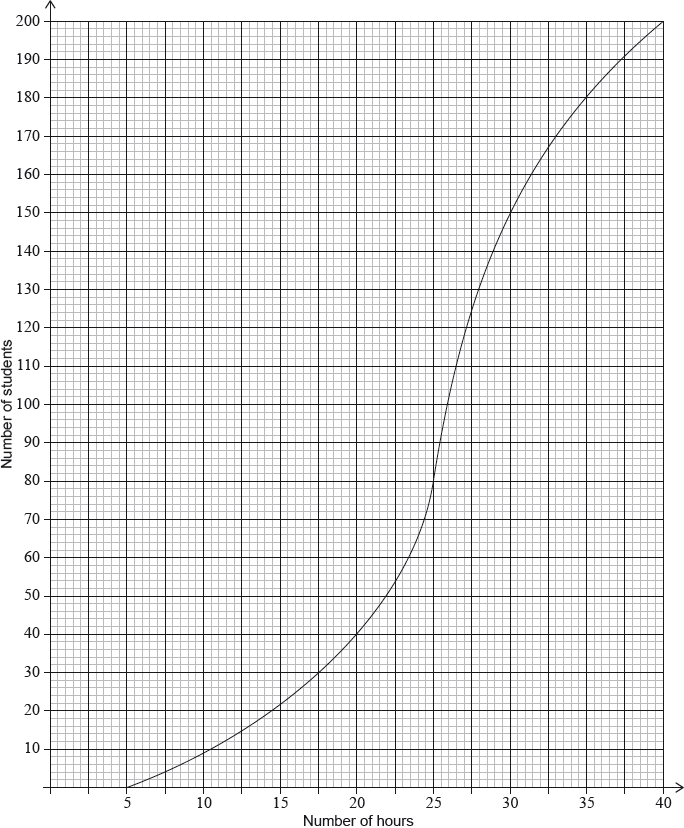
During week 4, the survey was extended to all 200 students in the school. The results are shown in the cumulative frequency graph:

Find the mean number of hours spent browsing the Internet.
During week 2, the students worked on a major project and they each spent an additional five hours browsing the Internet. For week 2, write down
(i) the mean;
(ii) the standard deviation.
During week 3 each student spent 5% less time browsing the Internet than during week 1. For week 3, find
(i) the median;
(ii) the variance.
(i) Find the number of students who spent between 25 and 30 hours browsing the Internet.
(ii) Given that 10% of the students spent more than k hours browsing the Internet, find the maximum value of .
Markscheme
* This question is from an exam for a previous syllabus, and may contain minor differences in marking or structure.
attempt to substitute into formula for mean (M1)
eg
mean A1 N2
[2 marks]
(i) mean A1 N1
(ii) A1 N1
[2 marks]
(i) valid approach (M1)
eg95%, 5% of 27
correct working (A1)
eg
median A1 N2
(ii) METHOD 1
variance (seen anywhere) (A1)
valid attempt to find new standard deviation (M1)
eg
variance A1 N2
METHOD 2
variance (seen anywhere) (A1)
valid attempt to find new variance (M1)
eg
new variance A1 N2
[6 marks]
(i) both correct frequencies (A1)
eg80, 150
subtracting their frequencies in either order (M1)
eg
70 (students) A1 N2
(ii) evidence of a valid approach (M1)
eg10% of 200, 90%
correct working (A1)
eg, 180 students
A1 N3
[6 marks]


