| Date | May 2018 | Marks available | 2 | Reference code | 18M.3.sl.TZ2.3 |
| Level | SL | Paper | 3 | Time zone | TZ2 |
| Command term | Distinguish | Question number | 3 | Adapted from | N/A |
Question
Inductively Coupled Plasma (ICP) used with Mass Spectrometry (MS) or Optical Emission Spectrometry (OES) can be used to identify and quantify elements in a sample.
The following graphs represent data collected by ICP-OES on trace amounts of vanadium in oil.
Graph 1: Calibration graph and signal for 10 μg kg−1 of vanadium in oil

Graph 2: Calibration of vanadium in μg kg−1

[Source: © Agilent Technologies, Inc.1998. Reproduced with Permission, Courtesy of Agilent Technologies, Inc.]
ICP-OES/MS can be used to analyse alloys and composites. Distinguish between alloys and composites.
ICP-MS is a reference mode for analysis. The following correlation graphs between ICP-OES and ICP-MS were produced for yttrium and nickel.
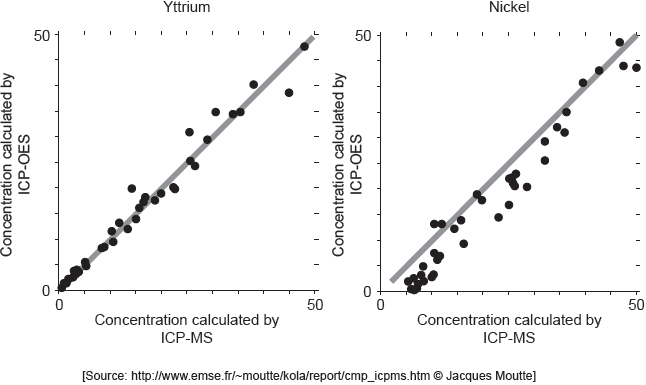
Each y-axis shows concentrations calculated by ICP-OES; each x-axis shows concentrations for the same sample as found by ICP-MS.
The line in each graph is y = x.
Discuss the effectiveness of ICP-OES for yttrium and nickel.
Identify the purpose of each graph.

Calculate, to four significant figures, the concentration, in μg kg−1, of vanadium in oil giving a signal intensity of 14 950.
Vanadium(V) oxide is used as the catalyst in the conversion of sulfur dioxide to sulfur trioxide.
SO2(g) + V2O5(s) → SO3(g) + 2VO2(s)
O2(g) + 2VO2(s) → V2O5(s)
Outline how vanadium(V) oxide acts as a catalyst.
Markscheme
Alloy:
mixture of metal with other metals/non-metals
OR
mixture of elements that retains the properties of a metal
Composite:
reinforcing phase embedded in matrix phase
Award [1 max] for implying “composites only have heterogeneous/nonhomogeneous compositions”.
[2 marks]
effective for yttrium «but less/not for nickel»
points on nickel graph do not lie on «y = x» line
OR
cannot be used for low concentrations of nickel
OR
concentration of nickel is lower than recorded value
Accept “ICP-OES is more accurate for lower yttrium concentrations than higher concentrations” for M1.
Accept [Ni] and [Y] for concentrations of nickel and yttrium.
Accept “detection limit for yttrium is lower than for nickel” for M2.
Award [1 max] for “more accurate for yttrium at lower concentrations AND nickel at higher concentrations”.
[2 marks]
Graph 1: determines wavelength of maximum absorption/maximum intensity «for vanadium»
Graph 2: determines absorption of known concentrations «at that wavelength»
OR
estimates [V]/concentration in a sample using «the signal» intensity
Do not accept just “determines maximum wavelength/λmax” for M1.
Do not accept “calibration curve” for M2.
[2 marks]
«14 950 = 392.19x + 147.62»
x = 37.74 «μg kg–1»
Answer must be given to four significant figures.
Do not accept values obtained directly from the graph.
[1 mark]
vanadium reduced in first reaction AND oxidized in second reaction
OR
V2O5 oxidizes SO2 in first reaction AND VO2 reduces O2 in second reaction
OR
vanadium returns to original oxidation state «after reaction»
provides an alternative reaction pathway/mechanism «with a lower activation energy» ✔
Do not accept “reactants adsorb onto surface AND products desorb”.
Accept “oxidation number” for “oxidation state”.
[2 marks]
Examiners report
Syllabus sections
-
18M.3.sl.TZ1.3b.i:
State the name given to a material composed of two distinct solid phases.
-
18M.3.sl.TZ1.3a:
Discuss, in terms of its structure, why an aluminium saucepan is impermeable to water.
-
17M.3.sl.TZ2.3a:
State the two distinct phases of a composite.
- 16N.3.sl.TZ0.3a: Magnesium oxide, MgO, and silicon carbide, SiC, are examples of ceramic materials. State the...
-
18M.3.sl.TZ1.4e:
Suggest why there are so many different ways in which plastics can be classified. HDPE can, for example, be categorized thermoplastic, an addition polymer, having Resin Identification Code (RIC) 2, etc.
-
19M.3.hl.TZ1.3a:
Identify the type of bonding in lithium hydride, using sections 8 and 29 of the data booklet.
-
19M.3.sl.TZ1.3a(i):
Identify the type of bonding in lithium hydride, using sections 8 and 29 of the data booklet.
- 16N.3.sl.TZ0.3b: Predict the predominant type of bonding for a binary compound AB in which the...
-
17M.3.sl.TZ2.3b:
Identify the methods of assembling nanocomposites by completing the table.

- 17N.3.sl.TZ0.4b.ii: At present, composite fillings are more expensive than amalgam fillings. Suggest why a...
-
17M.3.sl.TZ1.6a:
Determine the type of bond present in SbBr3, showing your method. Use sections 8 and 29 of the data booklet.
-
19N.3.sl.TZ0.5b(i):
Determine the percentage of ionic bonding in alumina using sections 8 and 29 of the data booklet.
-
18M.3.sl.TZ2.4c:
Civilizations are often characterized by the materials they use.
Suggest an advantage polymers have over materials from the iron age.
-
17N.3.sl.TZ0.4a:
Outline the composition of an alloy and a composite.

-
17M.3.sl.TZ1.6b:
Lanthanum has a similar electronegativity to group 2 metals. Explain, in terms of bonding and structure, why crystalline lanthanum bromide is brittle.
-
19M.3.hl.TZ2.4d:
Outline how alloys conduct electricity and why they are often harder than pure metals.
Conduct electricity:
Harder than pure metals:
-
19M.3.sl.TZ2.4d:
Outline how alloys conduct electricity and why they are often harder than pure metals.
Conduct electricity:
Harder than pure metals:
-
20N.3.hl.TZ0.3a:
Outline the two distinct phases of this composite.
-
18N.3.hl.TZ0.2a:
Outline why this type of classification is not entirely satisfactory by using magnesium diboride, MgB2, as an example. Refer to sections 8 and 29 of the data booklet.
-
18N.3.sl.TZ0.2a:
Outline why this type of classification is not entirely satisfactory by using magnesium diboride, MgB2, as an example. Refer to sections 8 and 29 of the data booklet.
-
20N.3.sl.TZ0.3a:
Outline the two distinct phases of this composite.