| Date | Marks available | 2+2 | Reference code | .2.bp.8 | |
| Level | SL and HL | Paper | 2 | Time zone | |
| Command term | Explain | Question number | 8 | Adapted from | N/A |
Question
The diagram shows some of the factors affecting vulnerability to hazards.
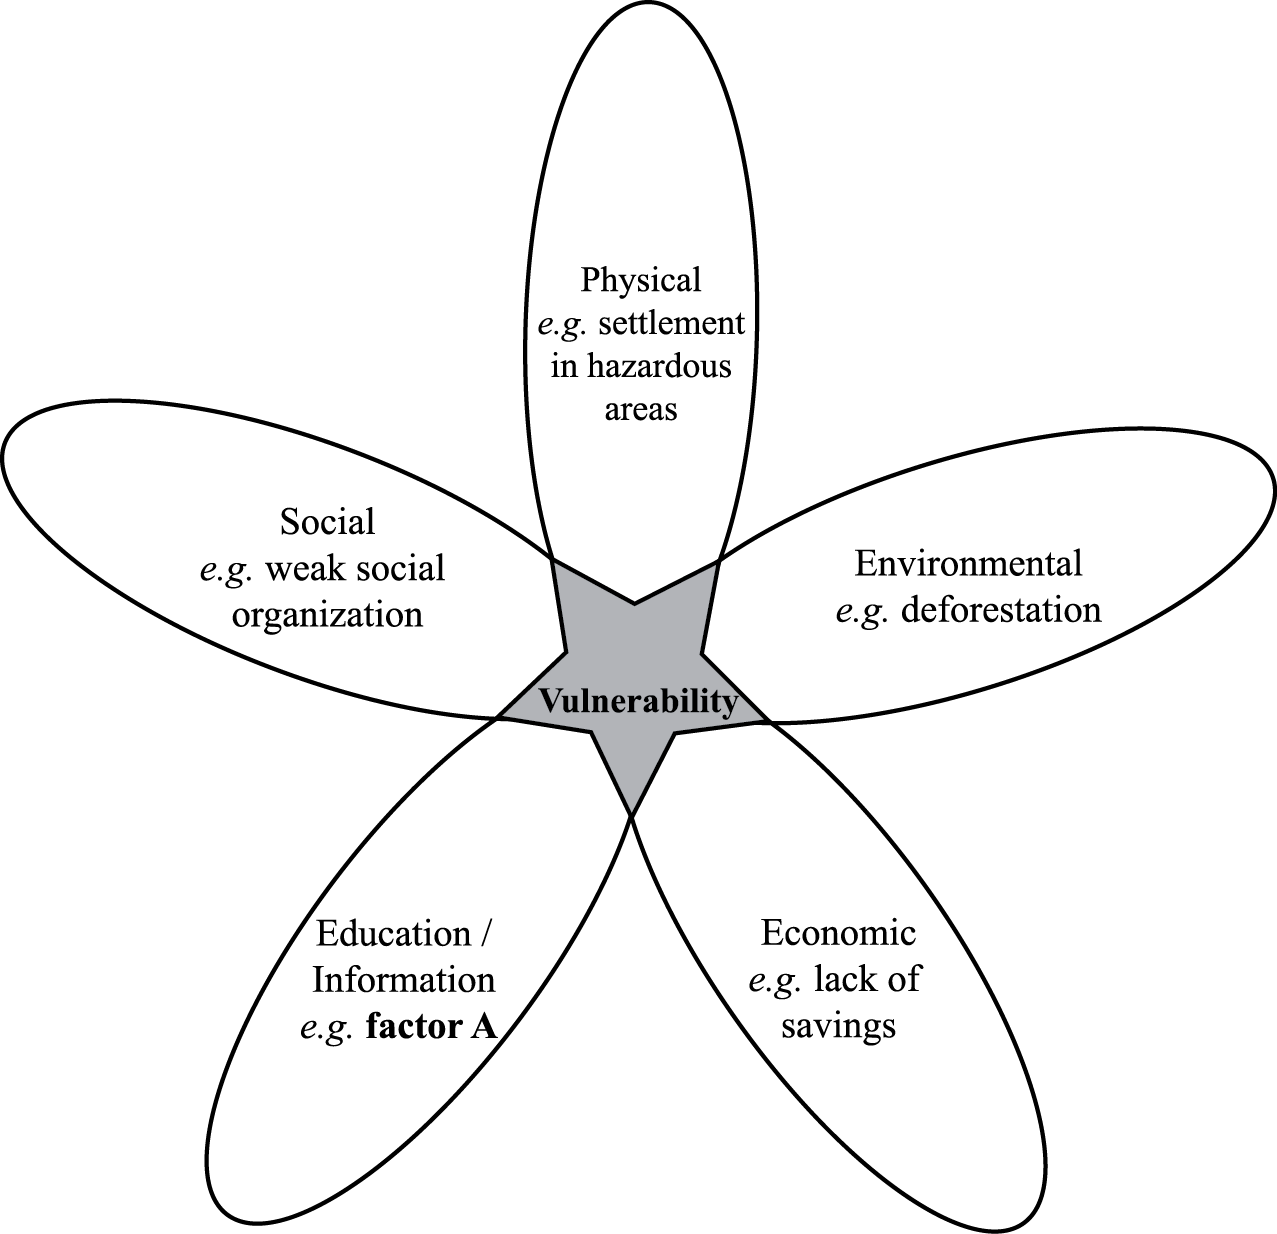
[Source: Richard Rhoda and Tony Burton. Mexico: A geographic perspective, Sombrero books (2009)]
Suggest what factor A on the diagram might be.
Explain how two of the other factors (other than factor A) shown on the diagram affect vulnerability to hazards.
Analyse why communities may underestimate the probability of a hazard event occurring.
For one or more hazards of your choice, examine how estimates are made for the probability and likely impact of a major hazard event.
Markscheme
Factor A might be earthquake drills in schools, or presence/absence of early warning systems. Award 1 mark for any valid suggestion, which must be related to education/information.
Award 2 marks for each explanation, which must be related to the concept of vulnerability, and not, for instance, to the severity of the hazard itself.
Underestimating the probability of a hazard event occurring may stem from many causes including a community’s misplaced optimism, having insufficient evidence available for a more accurate assessment, and an unrealistic belief that “it can’t happen (again) here”. Award 1 mark each for these or other valid statements, and a further 1 mark for each subsequent development of any point, up to the maximum of 5 marks.
There are many techniques used in risk assessment. They include the identification of trends and patterns, based on previous events. An example of the former would be working out the return intervals for major hurricanes; an example of the latter would be using gap theory to predict the location of the next major earthquake along a plate boundary. If the historical record is long enough, it is possible to calculate the probability of an event of any particular magnitude occurring with some degree of reliability. Assessing the likely impact of a major hazard event depends on the spatial analysis of the vulnerability of the population (lives and property). This may involve the use of GIS to identify areas where, for instance, housing types are less resilient to earthquakes, or where families cannot afford insurance against a specific hazard and have no financial reserves to recover quickly if a hazard event occurs.
Depending on the hazard event examined, there are numerous possible approaches to this question, but answers considering both aspects of the question (probability and likely impact) in some detail are likely to be credited at bands E/F. It is not necessary for the two aspects to be treated in equal detail.
A specific hazard event is a specific requirement of the question; it is expected in those answers achieving band D and above.
Marks should be allocated according to the markbands.