| Date | May 2018 | Marks available | 2 | Reference code | 18M.3.HL.TZ2.11 |
| Level | Higher level | Paper | Paper 3 | Time zone | Time zone 2 |
| Command term | Describe | Question number | 11 | Adapted from | N/A |
Question
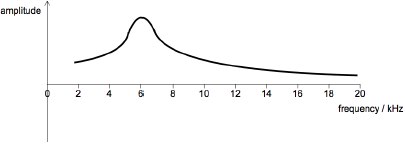
The natural frequency of a driven oscillating system is 6 kHz. The frequency of the driver for the system is varied from zero to 20 kHz.
Draw a graph to show the variation of amplitude of oscillation of the system with frequency.
[3]
a.
The Q factor for the system is reduced significantly. Describe how the graph you drew in (a) changes.
[2]
b.
Markscheme
general shape as shown
peak at 6 kHz
graph does not touch the f axis

[3 marks]
a.
peak broadens
reduced maximum amplitude / graph shifted down
resonant frequency decreases / graph shifted to the left
[2 marks]
b.
Examiners report
[N/A]
a.
[N/A]
b.
Syllabus sections
Option B: Engineering physics » Option B: Engineering physics (Additional higher level option topics) » B.4 – Forced vibrations and resonance (HL only)
Show 32 related questions

