| Date | May 2017 | Marks available | 2 | Reference code | 17M.3.HL.TZ2.11 |
| Level | Higher level | Paper | Paper 3 | Time zone | Time zone 2 |
| Command term | Sketch | Question number | 11 | Adapted from | N/A |
Question
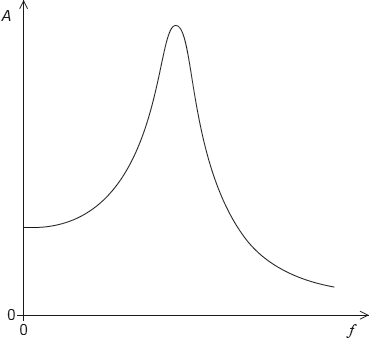
A driven system is lightly damped. The graph shows the variation with driving frequency f of the amplitude A of oscillation.

A mass on a spring is forced to oscillate by connecting it to a sine wave vibrator. The graph shows the variation with time t of the resulting displacement y of the mass. The sine wave vibrator has the same frequency as the natural frequency of the spring–mass system.
On the graph, sketch a curve to show the variation with driving frequency of the amplitude when the damping of the system increases.
State and explain the displacement of the sine wave vibrator at t = 8.0 s.
The vibrator is switched off and the spring continues to oscillate. The Q factor is 25.
Calculate the ratio \(\frac{{{\text{energy stored}}}}{{{\text{power loss}}}}\) for the oscillations of the spring–mass system.
Markscheme
lower peak
identical behaviour to original curve at extremes
peak frequency shifted to the left
Award [0] if peak is higher.
For MP2 do not accept curves which cross.
[2 marks]
displacement of vibrator is 0
because phase difference is \(\frac{\pi }{2}\) or 90º or \(\frac{1}{4}\) period
Do not penalize sign of phase difference.
Do not accept \(\frac{\lambda }{4}\) for MP2
[2 marks]
resonant f = 0.125 « Hz »
\(\frac{{25}}{{\left( {2\pi \times 0.125} \right)}}\) = 32 «s»
Watch for ECF from MP1 to MP2.
[2 marks]

