| Date | May 2010 | Marks available | 1 | Reference code | 10M.1.SL.TZ1.12 |
| Level | Standard level | Paper | Paper 1 | Time zone | Time zone 1 |
| Command term | Question number | 12 | Adapted from | N/A |
Question
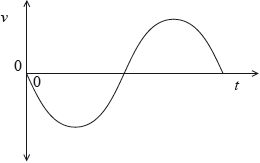
The graph shows how the velocity \(v\) of an object undergoing simple harmonic motion varies with time \(t\) for one complete period of oscillation.

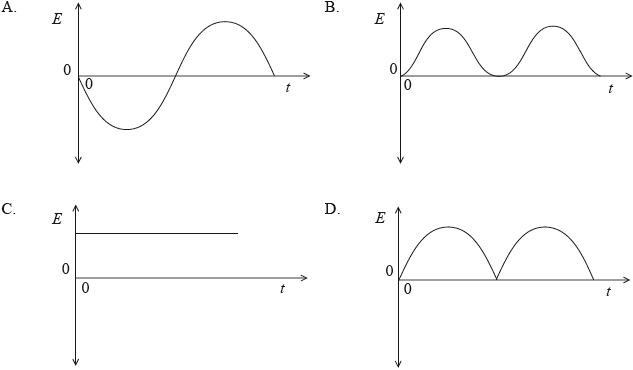
Which of the following sketch graphs best shows how the total energy \(E\) of the object varies with \(t\)?

Markscheme
C
Examiners report
[N/A]

