| Date | May 2009 | Marks available | 4 | Reference code | 09M.2.sl.TZ2.1 |
| Level | SL only | Paper | 2 | Time zone | TZ2 |
| Command term | Find | Question number | 1 | Adapted from | N/A |
Question
The following diagram is a box and whisker plot for a set of data.
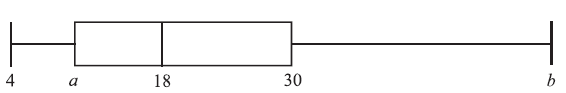
The interquartile range is 20 and the range is 40.
Write down the median value.
[1]
a.
Find the value of
(i) \(a\) ;
(ii) \(b\) .
[4]
b.
Markscheme
18 A1 N1
[1 mark]
a.
(i) 10 A2 N2
(ii) 44 A2 N2
[4 marks]
b.
Examiners report
Most candidates were able to find the values for the median, lower quartile, and point b. A large majority answered this question correctly.
a.
Most candidates were able to find the values for the median, lower quartile, and point b. A large majority answered this question correctly.
b.