| Date | November 2012 | Marks available | 2 | Reference code | 12N.1.bp.4 |
| Level | SL and HL | Paper | 1 | Time zone | |
| Command term | Describe | Question number | 4 | Adapted from | N/A |
Question
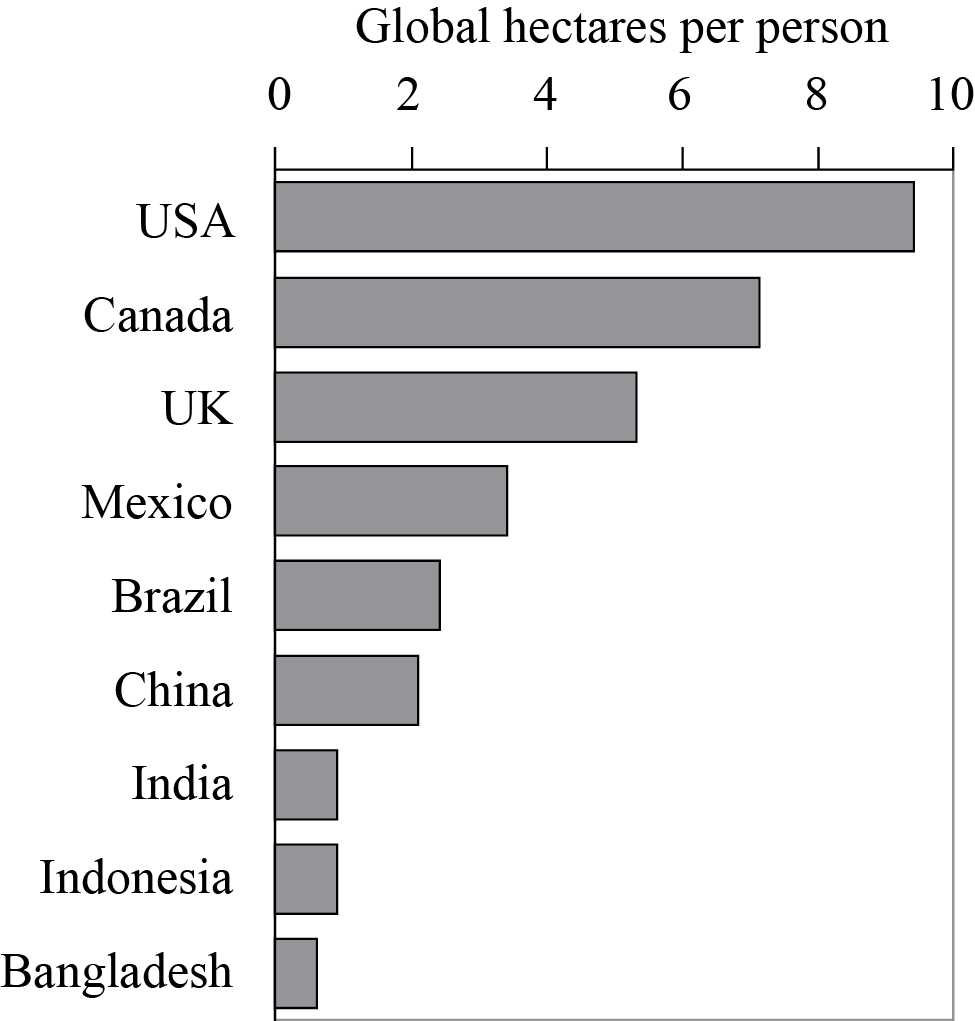
The graph shows the ecological footprints of various countries.

[Source: R Rhoda and T Burton, Geo-Mexico: The Geography and Dynamics of Modern Mexico (Sombrero Books, 2010)]
Define ecological footprint.
Describe how the pattern of ecological footprints shown by the graph reflects economic development.
(i) Outline a strategy at a local or national scale which is designed to reduce the consumption of one named resource.
(ii) Explain two reasons why the strategy described in (i) either has or has not been a success.
Markscheme
An ecological footprint is the theoretical measurement of the amount of land and water a population requires to produce the resources it consumes [1 mark] and to absorb its waste under prevailing technology [1 mark].
The relationship is that countries with higher economic development have larger footprints [1 mark]. Award a further [1 mark] for quantification.
(i) The strategy may involve resource substitution, conservation, recycling or waste reduction. Award [1 mark] for a valid, located strategy. Award a further [1 mark] for explaining how this reduces consumption. If no resource is named, no credit can be given.
(ii) There are many possible reasons. Award [1 mark] for identifying each valid reason, with a further [1 mark] for explanation. Award a maximum of [2 marks] in the event that the strategy is not clearly linked to the response given in (i).
Examiners report
The majority of candidates were familiar with the definition in the guide.
The relationship was easily identified but weaker responses offered no quantification.
(i) The best answers had a valid, located (local or national) strategy with explanations of how the consumption of a named resource (water and fossil fuels being the most popular) could be reduced. Some failed to identify the resource being conserved or the location of the strategy to be evaluated and as such could not be awarded any marks.
(ii) The best answers gave valid reasons, with explanations clearly linked to the response given in (i). Unfortunately one or two ignored the “either” and wrote one positive and one negative explanation, for which only the better of the two received credit.

