| Date | May 2011 | Marks available | 4 | Reference code | 11M.2.bp.13 |
| Level | SL and HL | Paper | 2 | Time zone | |
| Command term | Describe | Question number | 13 | Adapted from | N/A |
Question
The graph shows changes in the amount of sewage produced and treated in a rapidly growing megacity.
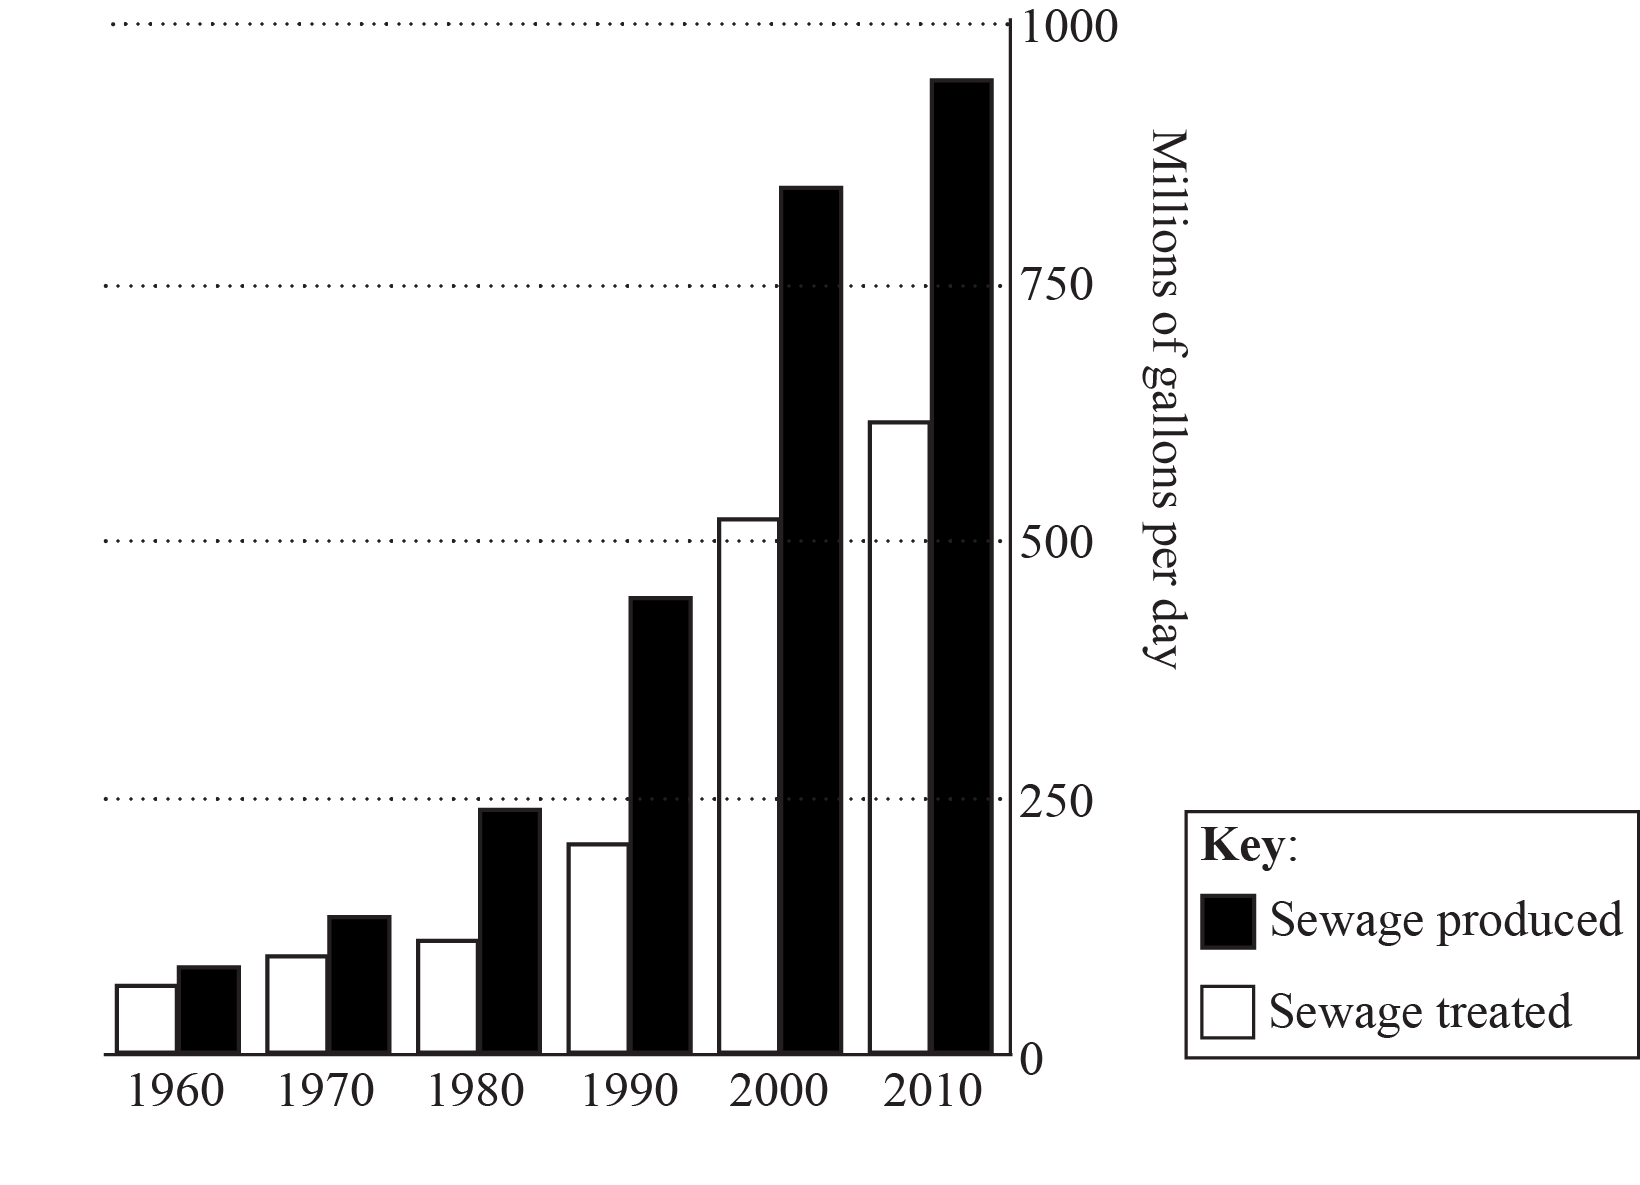
[Source: adapted from http://www.nytimes.com/imagepages/2006/09/29/world/20060929_WATER_GRAPHIC.html]
Describe the trends shown in the graph.
Explain three symptoms of urban stress.
“Urban poverty and deprivation are widespread in all cities.” Discuss this statement.
Markscheme
- The amount of sewage produced and treated both increase
- Sewage produced has increased at a faster rate than sewage treated
- Rate of growth has slowed since 2000
- Biggest increase between 1990 and 2000 in sewage produced and sewage treated
- Provides quantification.
Award 1 mark for each valid point. Quantification is needed for the award of the full 4 marks.
Urban stress is considered to be the inability of the urban system to cope with the demands of its population (either because of its size or its consumption).
Possible symptoms of urban stress could be:
- pollution (air or water) beyond acceptable levels, for example, photochemical smog
- widespread poverty, beyond ability of city authorities to provide social care
- lack of adequate housing evidenced by high levels of homelessness or informal housing
- inability of health services to cope with demands
- possible outbreaks of epidemic disease
- high levels of civil unrest or crime levels
- widespread traffic congestion or poor transport infrastructure.
Answers referring to physiological stress symptoms should not be credited.
1 mark should be awarded for each valid symptom of actual stress with 1 mark for a more developed explanation or elaboration. Maximum 2 marks for a simple list of problems (for example, unemployment, pollution, etc.).
Answers could approach the question in several valid ways.
A starting approach is to examine differences in poverty and deprivation within one urban area. This approach could argue that it is widespread in the chosen example and agree with the statement – this is sufficient for band D if well exemplified. An answer that shows that it is not widespread in a single city, and therefore disagrees with the statement could reach bands E/F.
Another approach is to look at contrasting urban areas and examine differences in poverty and deprivation between cities. This approach would most likely show that poverty and deprivation are more widespread in some cities than others. Such responses are also likely to reach bands E/F if they are detailed.
Marks should be allocated according to the markbands.
Examiners report
Generally very well done with accurate manipulation of data.
Surprisingly poorly done – many were able to list appropriate symptoms but explanations tended to be lacking or generalized. At standard level a number of responses incorrectly referred to the causes of urban growth or urban sprawl.
Relatively well done with good support. At the top end answers were excellent. At the lower end, answers were highly generalized with a lack of supporting examples and no real focus. The better responses were able to identify that poverty and deprivation occurs in cities in developed nations as well as in cities in less economically developed nations and were able to refer to affected locations in these cities.