| Date | May 2011 | Marks available | 10 | Reference code | 11M.2.bp.11 |
| Level | SL and HL | Paper | 2 | Time zone | |
| Command term | To what extent | Question number | 11 | Adapted from | N/A |
Question
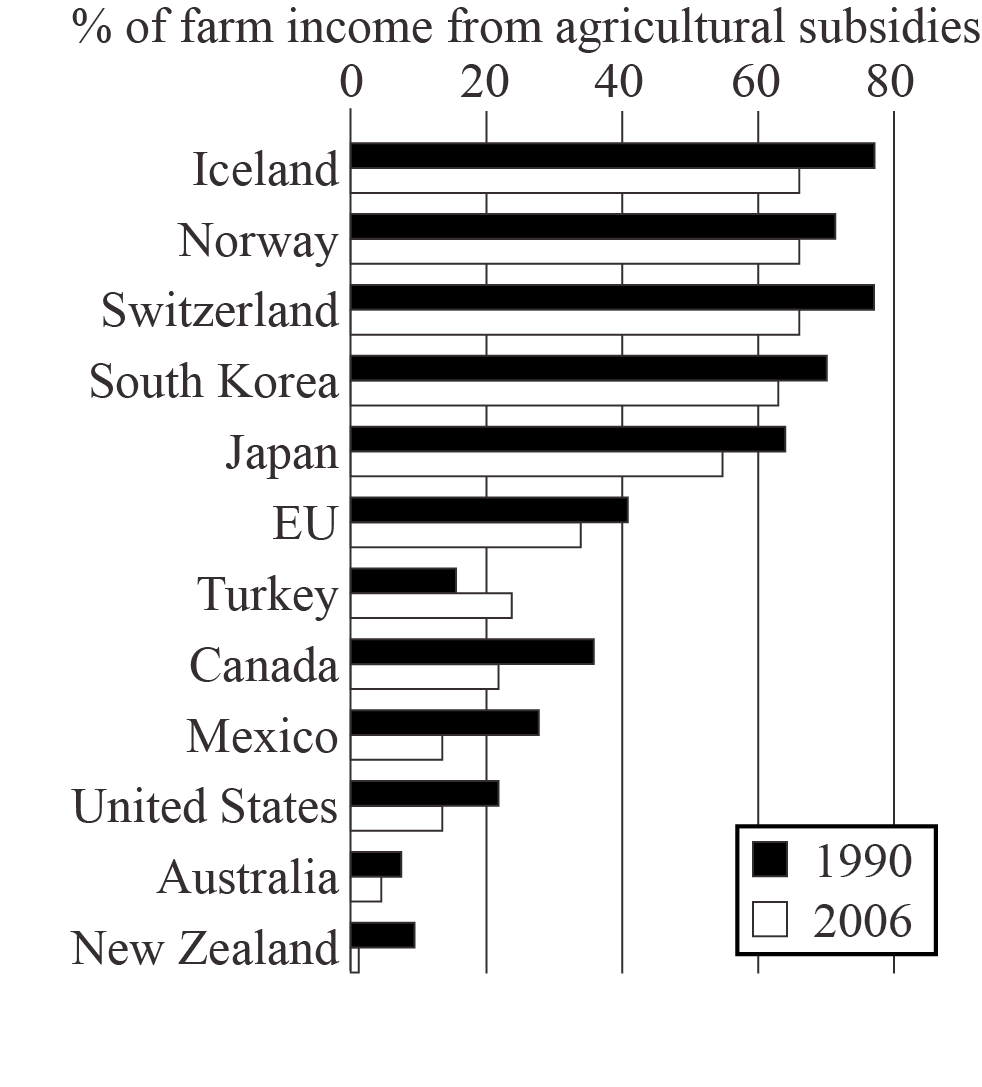
The graph shows the percentage of farm income from agricultural subsidies in 1990 and 2006 for 11 countries and the European Union (EU).

[Source: OECD data, cited in The Economist, 10 November 2007]
Describe the pattern of agricultural subsidies in 2006.
State two reasons why agricultural subsidies have declined in most countries since 1990.
Explain how the actions of TNCs can reduce the availability of food.
To what extent were human factors responsible for a recent famine?
Markscheme
Award 1 mark for any valid general statement, such as agriculture subsidies are higher in the northern hemisphere than the southern hemisphere, or agricultural subsidies are higher in European nations than in North America or Australasia, with an additional 1 mark for any supporting quantification.
No credit should be given for a simple list.
Award 1 mark each for any two valid reasons. These reasons include the reallocation of government resources since 1990 into other sectors of the economy; and the influence of the role of civil society or international trade organizations and their attempts to regulate subsidies.
There are numerous possible ways in which TNCs can reduce food availability. They may encourage an emphasis on the growing of non-food cash crops rather than food crops. They may gain control of the supply of seed for one or more basic crops; this seed may then be priced beyond the means of the average farmer or the seed may require higher than affordable investments in infrastructure or equipment in order for high yields to be obtained.
At least two actions must be explained for the full 6 marks. Award 1 mark for each valid action, plus an additional 1 mark for explaining it, and a final 1 mark for an example, quantification or further detail.
Candidates are expected to consider a range of human factors and other factors (such as physical/environmental, economic and political) in their responses. Answers should clarify how each factor affected the occurrence, severity and outcome of a particular famine.
Possible human factors include: age and education of agricultural workforce; extent to which population is concentrated in a few large cities, or dispersed across a wide area; migration flows.
Economic factors include: ability to purchase food supplies from outside the area or country; deficiencies in the transport system reducing the effectiveness of food distribution; lack of capital to replant or restock farms.
Political factors might include: war and refugee movements; refusal to accept international food aid.
Possible physical/environmental factors include: soil degradation; climate change; natural hazard events such as hurricanes or earthquakes.
While many responses are likely to conclude that human factors are not the main cause of famine, all conclusions should be judged strictly on the merits of the arguments presented and the example chosen.
Answers arriving at a clear conclusion about the relevance of human factors to a specific recent famine are likely to be credited at band D and above.
Where responses refer to more than one famine event in different countries, only the best one should be credited.
Marks should be allocated according to the markbands.
Examiners report
Many candidates listed countries and gave some quantification. Relatively few identified a pattern.
This was answered quite poorly; relatively few suggested valid reasons for the decline in agricultural subsidies.
This prompted a variety of responses from those who explained why food availability would increase, to those who gave a variety of reasons why food availability might decrease.
There were many good answers that included a variety of human and physical factors, and a recent famine, for example, East Africa 2011. A small minority of candidates used inappropriate examples (that is, not in the candidates' lifetime).

