| Date | November 2013 | Marks available | 3 | Reference code | 13N.1.bp.2 |
| Level | SL and HL | Paper | 1 | Time zone | |
| Command term | Describe | Question number | 2 | Adapted from | N/A |
Question
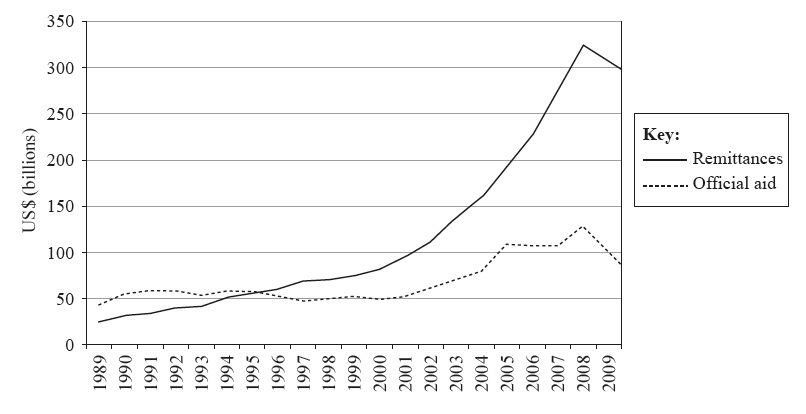
The graph shows migrants’ remittances and official aid to low and middle income countries, 1989–2009, in billions of US Dollars (USD).

[Source: The World Bank, World Bank Migration and Remittances Factbook 2011 (2011)]
Define the term remittances.
Referring to the graph, describe the trend in remittance flows since 1989.
Suggest three reasons why international financial aid is not always effective.
Markscheme
Transfers of money/goods [1 mark] by foreign/migrant workers to their home countries [1 mark].
Increasing steadily from 1989 (US$ 50 billion) to a peak (US$ 325 billion) in 2007 [1 mark]; from 2007 onwards sharp decline to below US$ 300 billion [1 mark]. Accurate quantification (+/- 10 billion) and use of dates essential for final [1 mark].
Award [1+1 mark] for each valid reason, provided that it is developed by means of explanation and/or exemplification.
Possibilities include: insufficient aid (few donors achieving UN target of 0.7% of GDP); wrong type of aid; some aid results in debt; aid targets specific groups within a population who are not always the poorest; unreliable source of funding (can be tied/withdrawn); there are other more reliable sources of income; can be subject to corruption; conditionality; spatial isolation; not spent in the correct manner; targets short term problems.
Allow other valid reasons.

