| Date | May 2015 | Marks available | 1 | Reference code | 15M.1.sl.TZ2.4 |
| Level | SL only | Paper | 1 | Time zone | TZ2 |
| Command term | Write down | Question number | 4 | Adapted from | N/A |
Question
Two groups of 40 students were asked how many books they have read in the last two months. The results for the first group are shown in the following table.
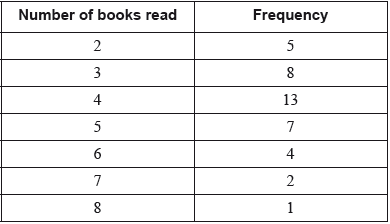
The quartiles for these results are 3 and 5.
Write down the value of the median for these results.
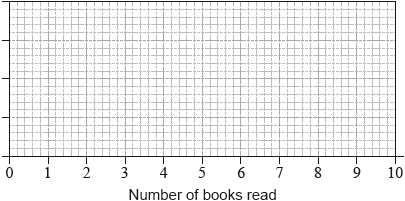
Draw a box-and-whisker diagram for these results on the following grid.
The results for the second group of 40 students are shown in the following box-and-whisker diagram.
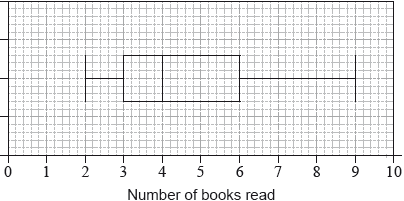
Estimate the number of students in the second group who have read at least 6 books.
Markscheme
\(4\) (A1)(C1)
 (A1)(ft)(A1)(A1) (C3)
Notes: Award (A1)(ft) for correct median, (A1) for correct quartiles and box, (A1) for endpoints 2 and 8 joined by a straight line that does not cross the box. Follow through from their median from part (a).
\(40 \times 0.25\) (M1)
Notes: Award (M1) for \(40 \times 25\% \;\;\;\)OR\(\;\;\;40 - 40 \times 75\% \).
\(10\) (A1) (C2)