| Date | May 2011 | Marks available | 1 | Reference code | 11M.1.bp.3 |
| Level | SL and HL | Paper | 1 | Time zone | |
| Command term | State | Question number | 3 | Adapted from | N/A |
Question
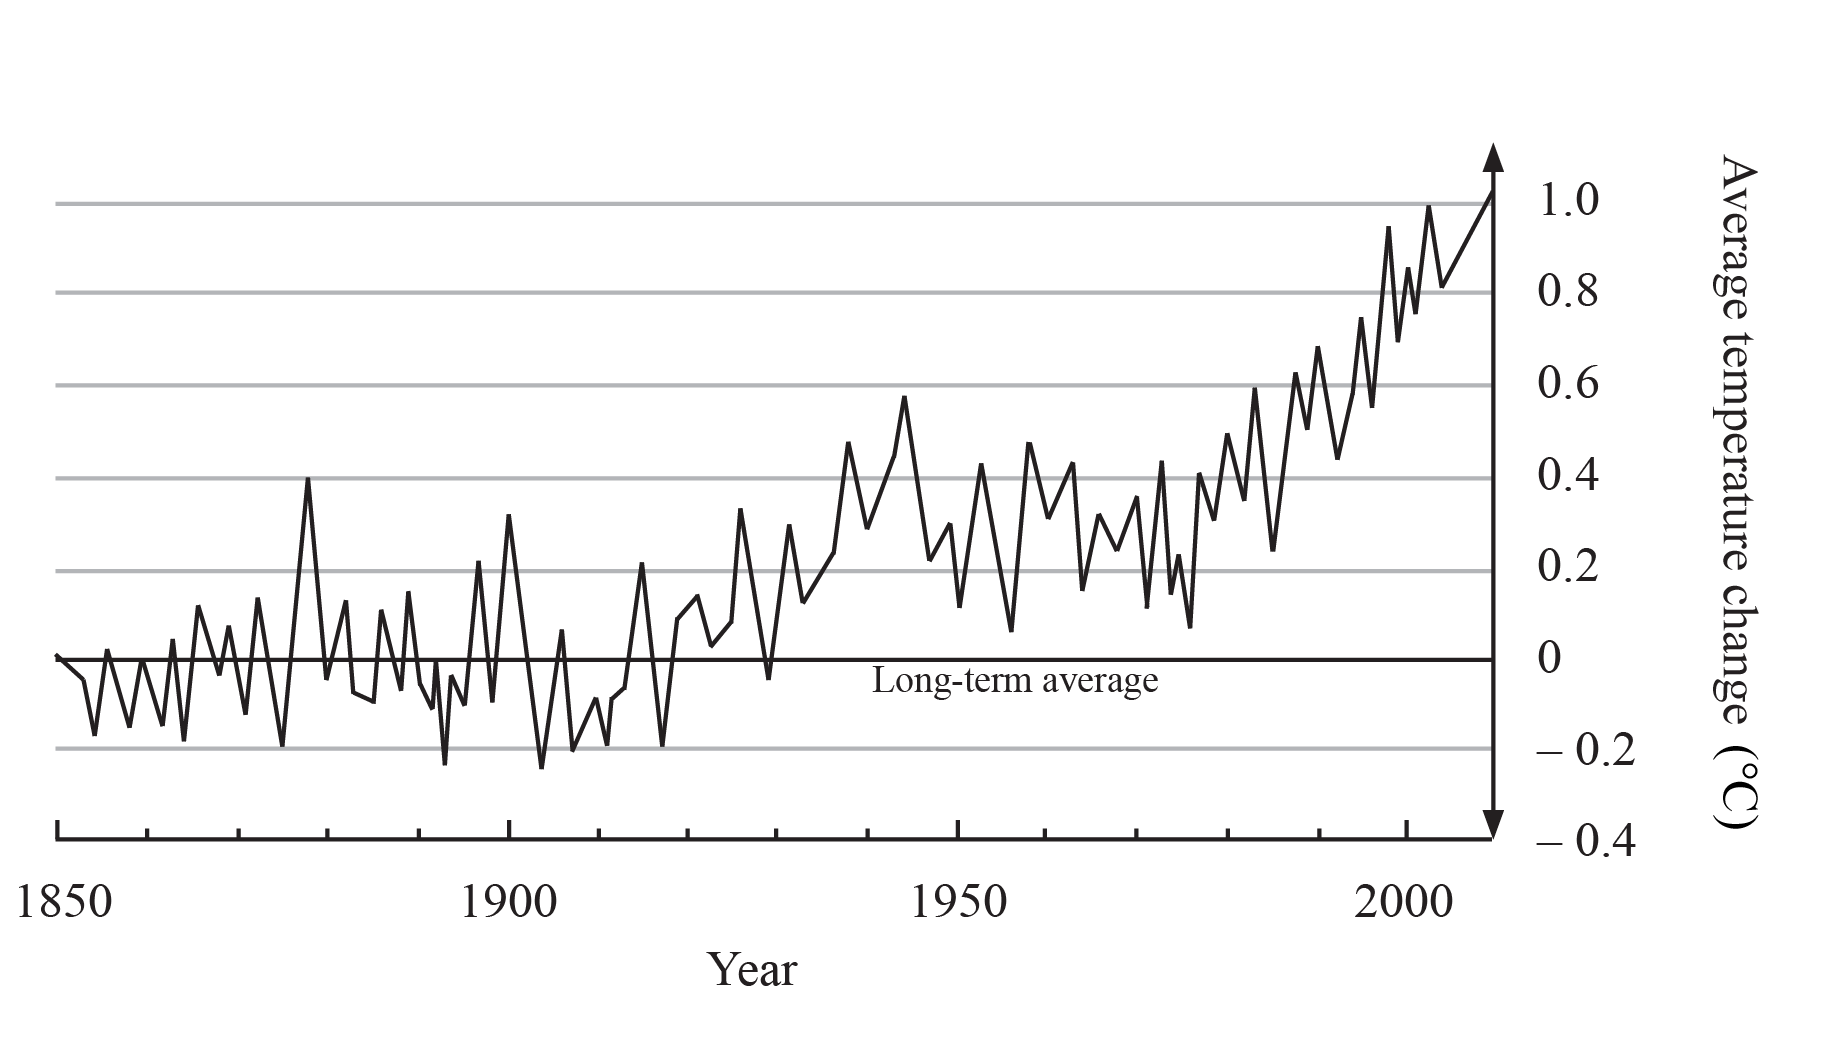
The graph shows global temperature changes since 1850.

[Source: IPCC – data based on a graph in The Economist, 9 September 2006]
State one natural external forcing which could have influenced the changes in temperature shown on the graph.
Referring to the graph, describe how temperature has changed since 1850.
Explain three possible environmental consequences of global climate change since 1950.
Markscheme
Award 1 mark for naming a natural external forcing. Any changes in solar radiation; changes in the orbital path of the Earth; volcanic eruptions (these are acceptable as external to atmospheric system). The answer must be external to the Earth’s atmospheric system.
Average temperatures remained more or less stable at first/until 1910–1930 [1 mark]. After that time, average temperatures have risen significantly/there has been an overall increase [1 mark]. The final 1 mark is reserved for quantification or for describing how temperatures have always oscillated/fluctuated, though these have not altered the overall trend.
There are many possible answers here. Award 1+1 marks for each valid environmental consequence, provided that it is developed by means of examples, explanation or detail. No credit should be awarded for any consequence that is not environmental in nature, or for statements such as “temperatures have risen” since that is implicit in the question.
Valid possible environmental consequences include: poleward shift in some natural vegetation belts; rise in sea levels; alterations to migration routes of animals; expansion of some deserts; greater frequency and severity of tropical storms and hurricanes; record-breaking climate extremes; melting of Arctic ice; retreat of glaciers in most parts of the world.
Examiners report
There seemed to be quite a lot of confusion in identifying a natural external forcing. Technically this needs to be external to the Earth's atmospheric system and as such only a limited range of answers could be credited. As these correct answers were relatively few and far between and this is a new syllabus we allowed for some flexibility with this question. Please refer to the markscheme for the acceptable answers.
Candidates have become more confident in describing trends. On the whole this was well answered. Those who did not gain all three points generally found it difficult to relate the first period in the graph (1850–1920) to the long-term temperature average.
Most candidates had quite a lot to write here with detailed knowledge of potential environmental consequences with good explanation and exemplification. For example, ice caps melting – habitat loss – polar bears vulnerable. In some minor cases sticking to environmental impacts proved problematic, as responses came back to the impact on humans rather than ecosystems of natural environments.

